Introduction
In Part 1 of this series on using the Matomo Plugin in WordPress, we focused on building the foundation for accurate, privacy-friendly analytics. We walked through how to get started with Matomo, update your privacy page, and enable tracking to ensure your data collection is fully compliant. We also explored key Matomo reports,
Now it’s time to take the next step.
In Part 2, we’ll go beyond basic tracking and dive into the deeper reporting features inside Matomo that help you uncover behavior patterns, identify what drives traffic, track conversions, and optimize your site for growth.
In this part, we’ll cover advanced insights across:
- Behaviour Reports
- Get a detailed view into how people engage with your site
- Acquisition Reports
- Understand exactly where your visitors are coming from
- E-commerce Reports
- Track user journey, revenue sources, and product-level performance
- Goals & Conversions
- Measure actions that matter most to your business
Behavior
The behavior settings let you control how visitor interactions are tracked, including link tracking, downloads, site search, and other engagement actions.”
Pages
This screen shows which pages visitors viewed and how often.
It shows the following data:
- Pageviews
- Unique Pageviews
- Bounce Rate
- Avg. time on page
- Exit rate
- Avg. page load time
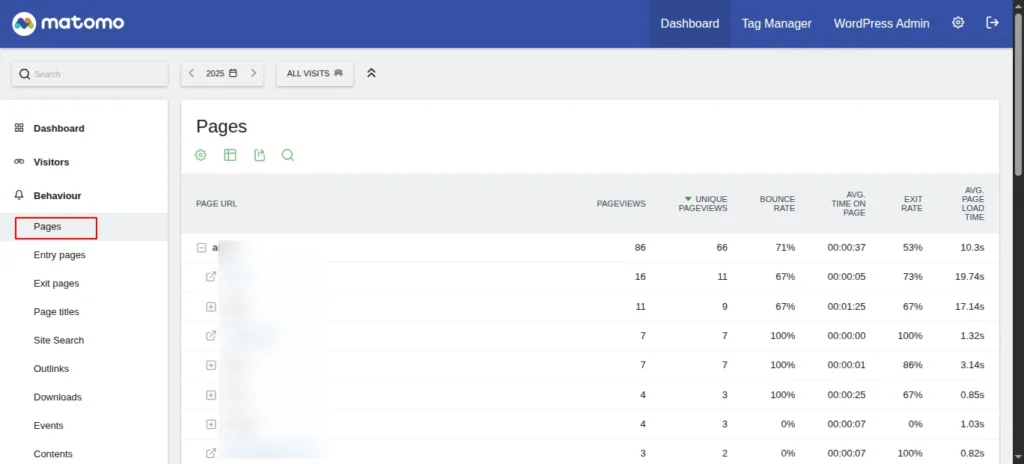
Screenshot 1: Behaviour → Pages
Entry pages
This screen shows which pages visitors land on first during a session.
It shows the following data:
- Entrances (the number of visits that were started on the page)
- Bounces
- Bounce Rate
- Avg. page load time
- Entry Page Titles (Related Report)
- Lists landing pages by page title instead of URL.
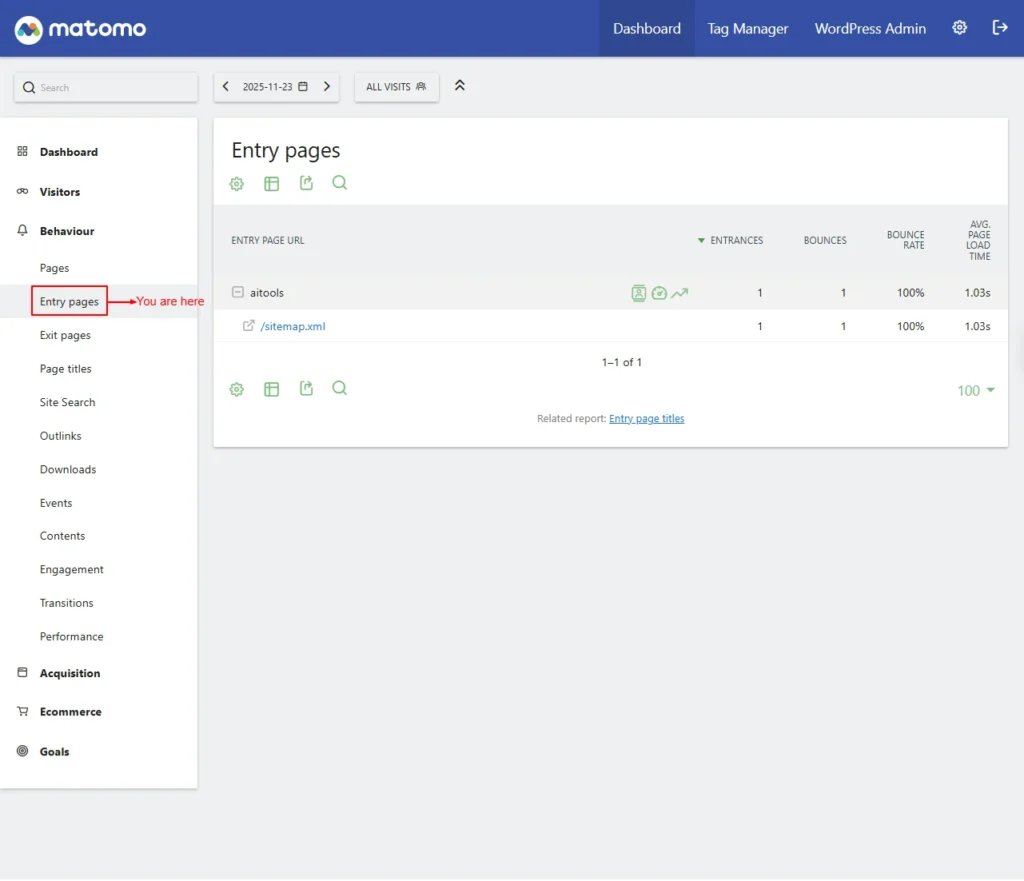
Screenshot 2: Behaviour → Entry Pages
Exit pages
Shows the pages where visitors most commonly leave your site.
It shows the following data:
- Exits
- Unique Pageviews
- Exit rate
- Avg. page load time
- Exit Page Titles (Related report)
- Displays exit pages by page title instead of URL.
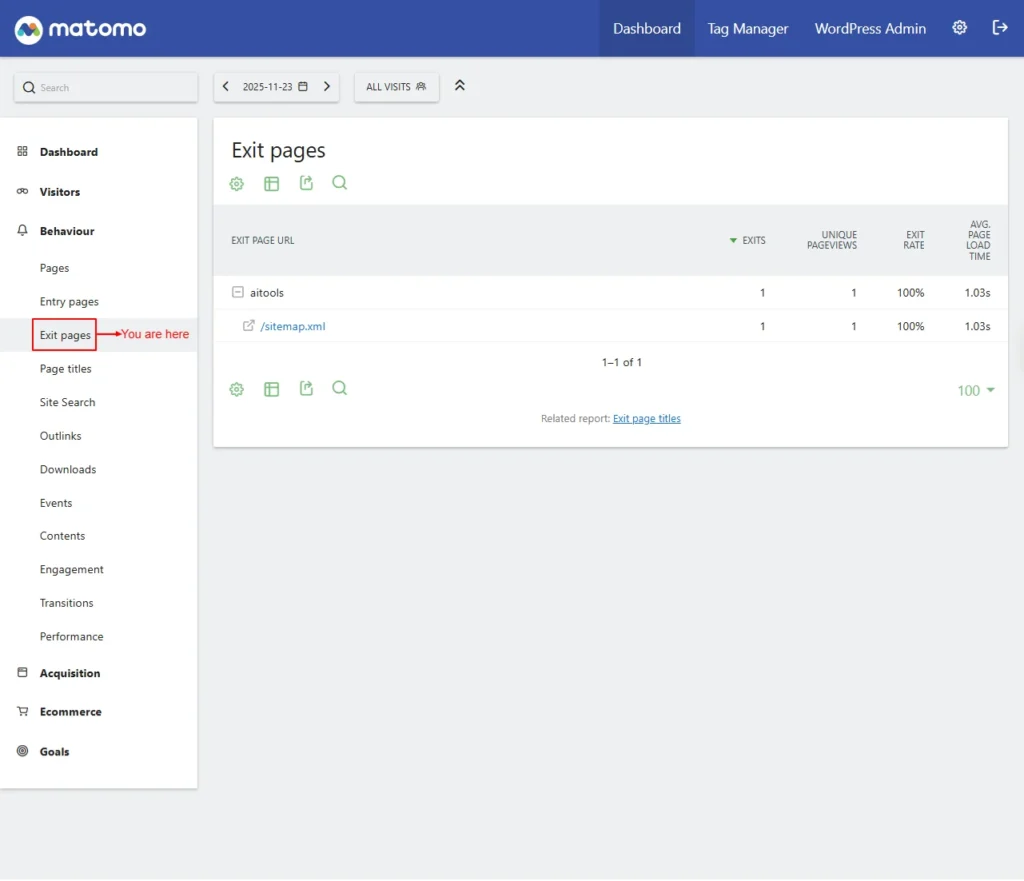
Screenshot 3: Behaviour → Exit Pages
Page titles
Shows how often each page title was viewed.
It shows the following data:
- Page Title
- Pageviews
- Unique Pageviews
- Bounce Rate
- Avg. time on page
- Exit rate
- Avg. page load time
- Entry Page Titles (Related Report): Shows first-visited pages by title.
- Exit Page Titles (Related Report): Shows last-visited pages by title.
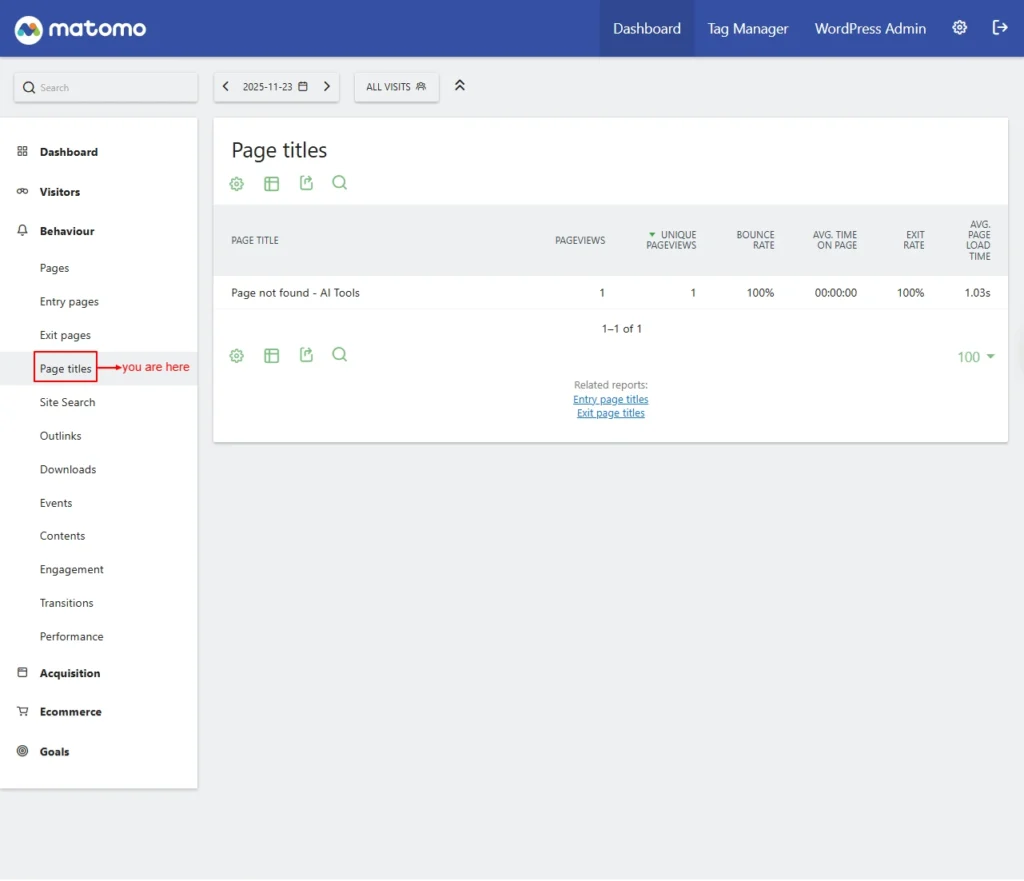
Screenshot 4: Behaviour → Page Title
Site Search
The Site Search settings allow you to track what visitors search for on your website, helping you understand their interests and improve content discovery.
- Site Search Keywords: Shows keywords visitors searched for on your site.
- Search Keywords with No Results: Lists search terms that returned no results.
- Pages Following a Site Search: Displays which pages users visited after searching.
- Page Titles Following a Site Search (Related Report): Shows post-search destinations by page title.
- Search Categories: Groups internal searches by category.
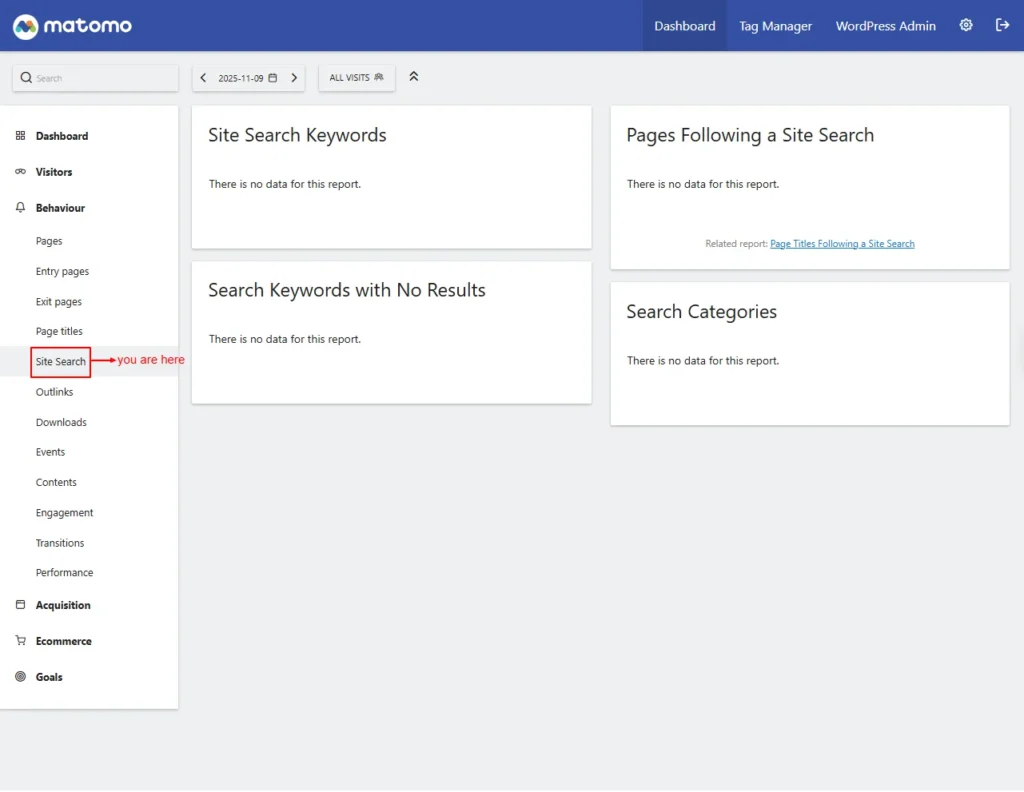
Screenshot 5: Behaviour → Site Search
Outlinks
Shows links clicked that lead visitors to external websites.
Screenshots 6: Behaviour → Outlinks
Downloads
Shows files that visitors downloaded from your site.
Screenshots 7: Behaviour → Downloads
Events
Tracks user interactions like clicks, video plays, and more.
- Event Categories: Groups events by category (e.g., video, button).
- Event Actions: Shows the specific action taken (e.g., play, download).
- Event Names: Provides detailed labels identifying each event.
| Note: Currently, no custom events are configured. You can learn more about setting them in the Event Tracking guide. We’ll cover creating custom events using Matomo Tag Manager in a separate tutorial, since it requires an in-depth explanation and deserves a full blog of its own. |
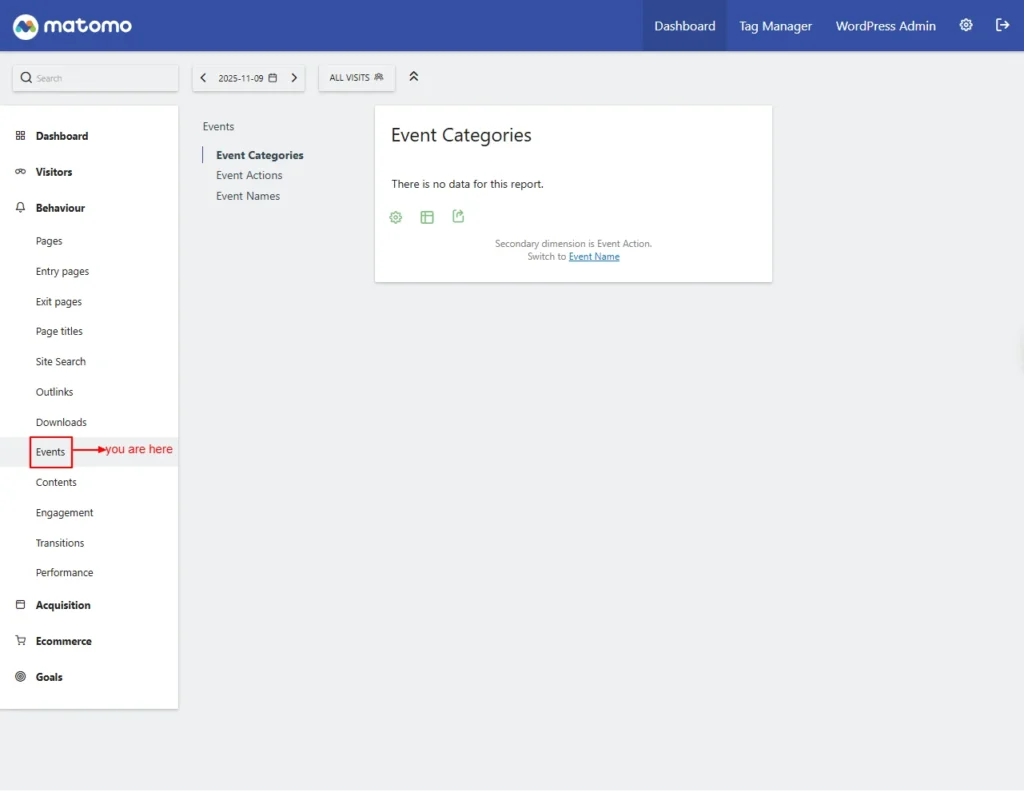
Screenshot 8: Behaviour → Events
Contents
Content tracking helps you understand which pieces of content are most engaging on any page of your website or app. This section shows how often each content element is viewed (impressions) and interacted with.
- Content Name: Identifies the specific content block or widget being tracked.
- Content Piece: The actual item displayed (e.g., image, text, button) within the content name.
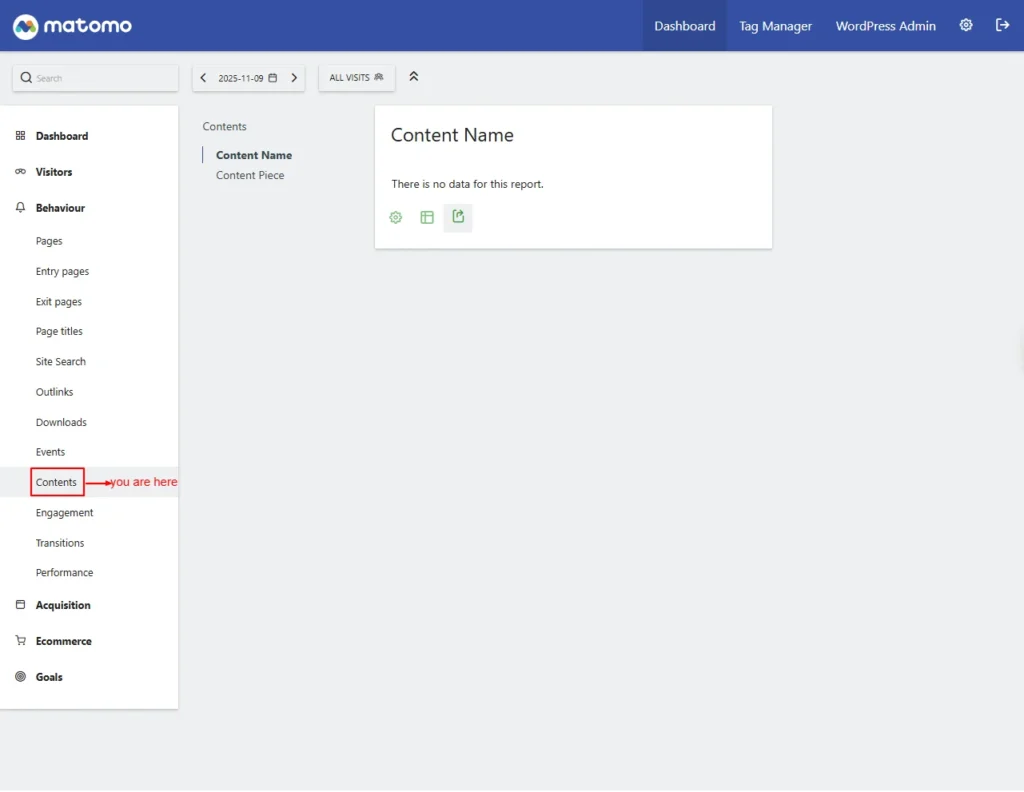
Screenshot 9: Behaviour → Contents
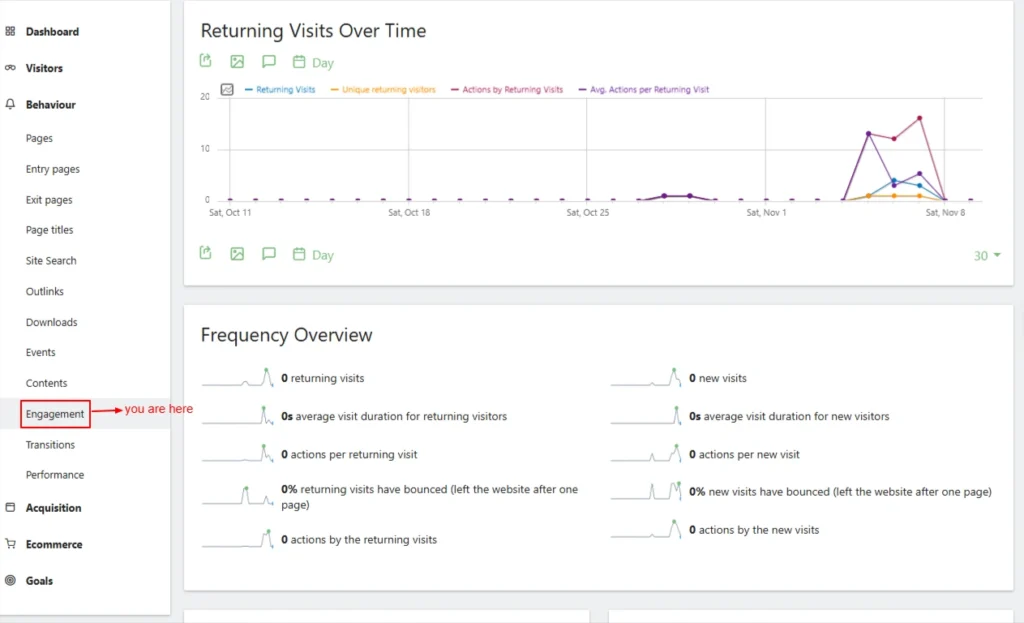
Engagement
The Engagement settings track how visitors interact with your site, including actions like time spent, scroll depth, and repeat visits, helping you measure user involvement.”
- Returning Visits Over Time: This chart shows returning visits over time. You can view by day, week, month, or year.
- Frequency Overview: Summary of engagement for new vs returning visitors.
- It shows the following data:
- Returning Visits: Number of visitors returning to the site.
- Avg. Visit Duration (Returning): Average time returning visitors stayed.
- Actions per Returning Visit: Average actions done by returning visitors.
- Returning Bounce Rate: The percentage of returning visitors who left after one page.
- (Total) Actions (Returning): Total actions taken by returning visitors.
- New Visits: Number of first-time visitors.
- Avg. Visit Duration (New): Average time new visitors stayed.
- Actions per New Visit: Average actions done by new visitors.
- New Visitor Bounce Rate: Percentage of new visitors who left after one page.
- (Total) Actions (New): Total actions taken by new visitors.
- Visits per Visit Duration: Shows the Tag cloud of Group visits by time spent.
- Visits per Number of Pages: Shows the Tag cloud of group visits by number of pages viewed.
- Visits by Visit Number: Shows how often visitors return (1st, 2nd, 3rd visit, etc.).
- Visits by Days Since Last Visit: Shows how long it has been since each returning visitor last visited.
Screenshot 10: Behaviour → Engagement
Transitions
Transitions show what visitors did right before and after viewing a specific page, helping you understand where they came from and where they went next.
Action Type
- Page URLs: View transitions based on page URLs.
- Page Titles: Shows how users arrived at a page (by title) and where they went next.
- Top 100 Labels: Displays the most common sources and destinations.
Note: You can open Transitions directly from Page URLs, Page Titles, Entry Pages, and Exit Pages by clicking the Transitions icon beside each row.
![]()
Screenshot 11: Behaviour → Transitions
![]()
Screenshot 12: Transition before and after viewing a specific page
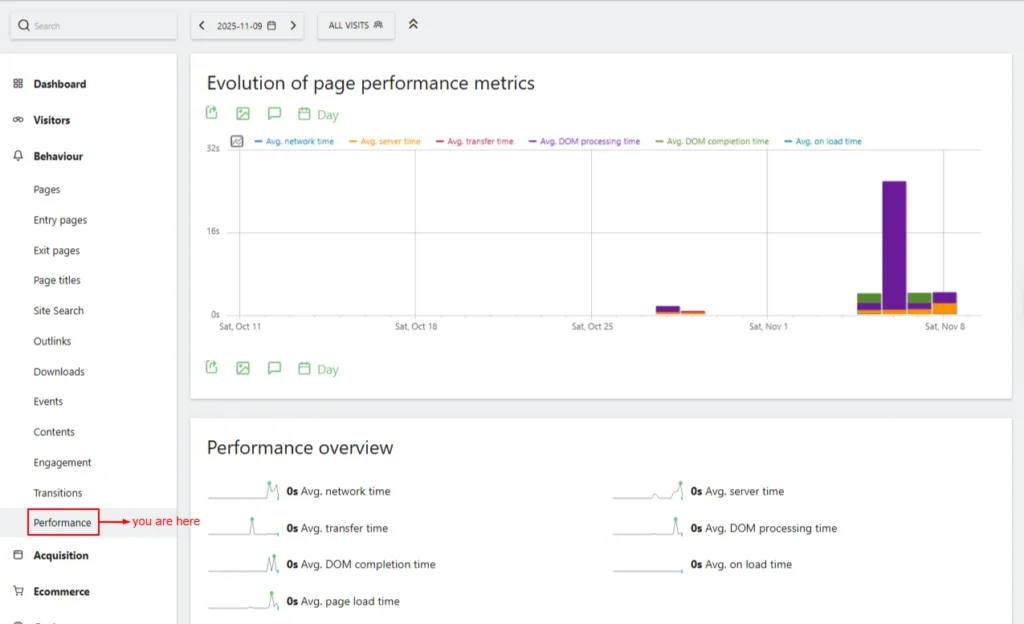
Performance
The Performance settings help optimize how tracking loads on your site, ensuring accurate analytics
- Evolution of Page Performance Metrics: This graph shows how page speed metrics change over time.
- Performance Overview
- Avg. network time: time to establish network connection.
- Avg. transfer time: Time to download page resources.
- Avg. DOM completion time: Time for the HTML document to finish loading.
- Avg. page load time: Total time for a page to fully load.
- Avg. server time: The time the server takes to respond.
- Avg. DOM processing time: Time the browser spends processing the page.
- Avg. on-load time: Time until the browser on-load event finishes.
- Page URLs: Shows performance metrics for individual page URLs.
- Entry pages / Exit pages (Related reports): View load performance for landing and exit pages.
- Page titles: Displays performance metrics by page title.
- Entry page titles / Exit page titles (Related reports): Shows performance for landing/exit pages by title.
Screenshot 13: Behaviour → Performance
Acquisition
Shows how visitors find your website, including traffic sources like search engines, social media, referrals, campaigns, and direct visits.
Overview
This screen shows an overview of the visits channel-wise.
- Evolution Over the Period: This graph provides a snapshot of the referral sources that brought visitors to your website.
- Channel Type: Shows which traffic channels (Direct, Search, Social, Referral, Campaigns) are bringing visitors to your site.
- Direct Entries: Visits that came directly (no referrer).
- Search Engines: Visits from search engine results.
- Campaigns: Visits from tracked marketing campaigns.
- Social Networks (Distinct): Number of unique social platforms sending traffic.
- Keywords (Distinct): Number of unique search keywords used.
- Websites: Visits from external websites.
- Social Networks: Traffic from social media sites.
- Search Engines (Distinct): Unique search engines bringing traffic.
- Websites (Distinct): Unique referring external sites.
- Campaigns (Distinct): Unique campaign IDs sending traffic.
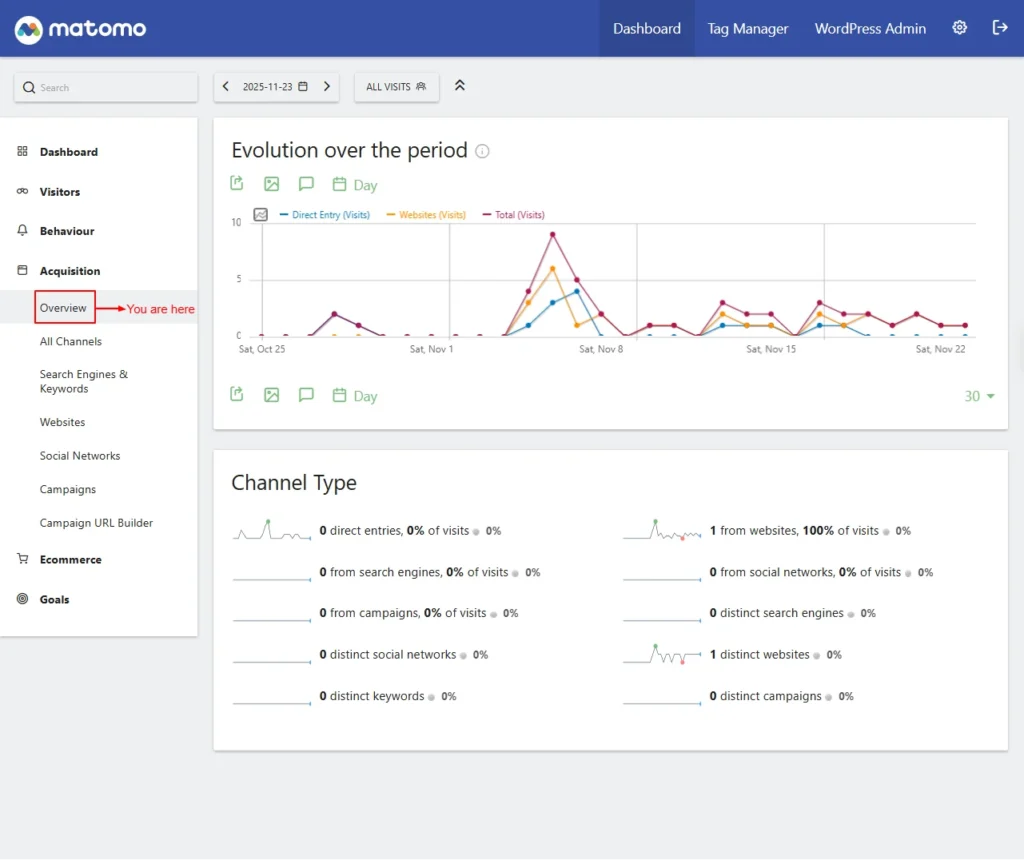
Screenshot 14: Acquisition → Overview
All Channels
Displays a breakdown of all traffic sources, showing how visitors arrived on your site across every channel type.
- Channel Types: Displays how visitors arrived (e.g., direct, search, social, campaigns).
- Referrers: Shows external websites or sources that sent visitors to your site.
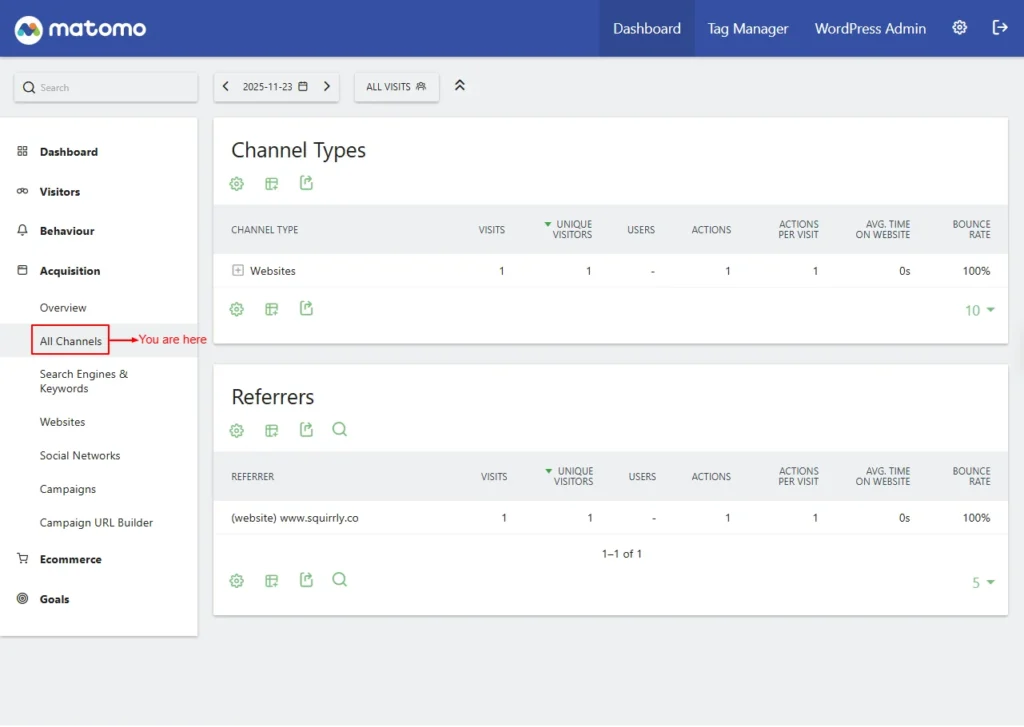
Screenshot 15: Acquisition → All Channels
Search Engines & Keywords
Shows which search engines send traffic to your site and which keywords visitors use to find you.
- Keywords: Shows search terms users typed to find your website in search engines.
- Search Engines: Lists which search engines (Google, Bing, etc.) brought visitors to your site.
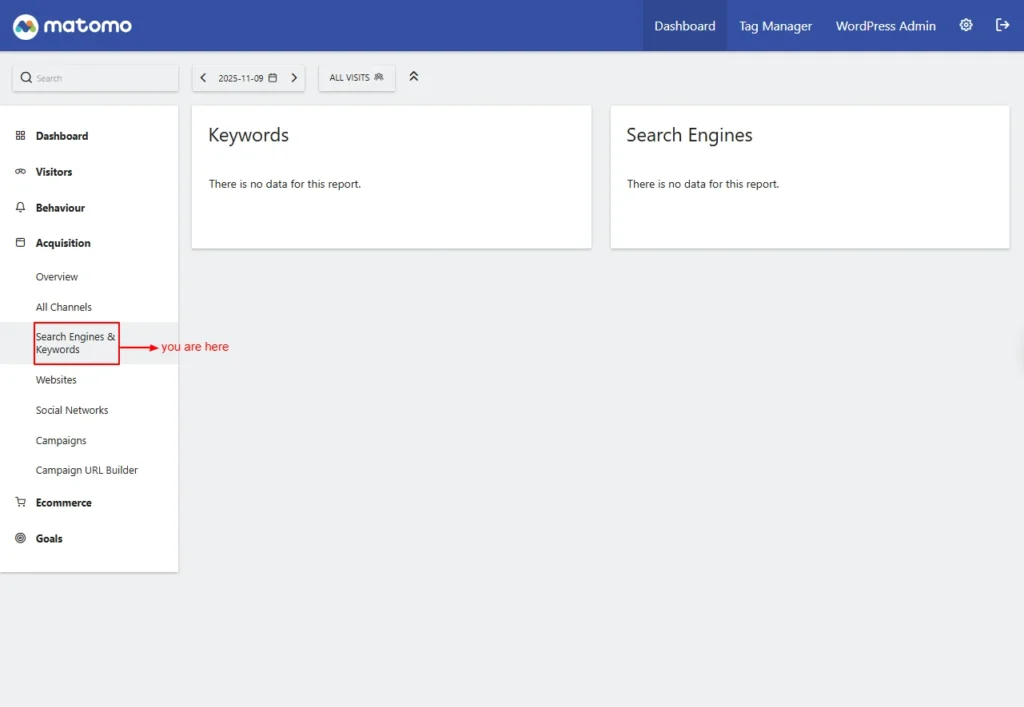
Screenshot 16: Acquisition → Search Engines and Keywords
Websites
Shows which external websites sent traffic (referrals) to your site.

Screenshot 17: Acquisition → Websites
Social networks
Displays traffic coming from social platforms like Facebook, LinkedIn, or Twitter.
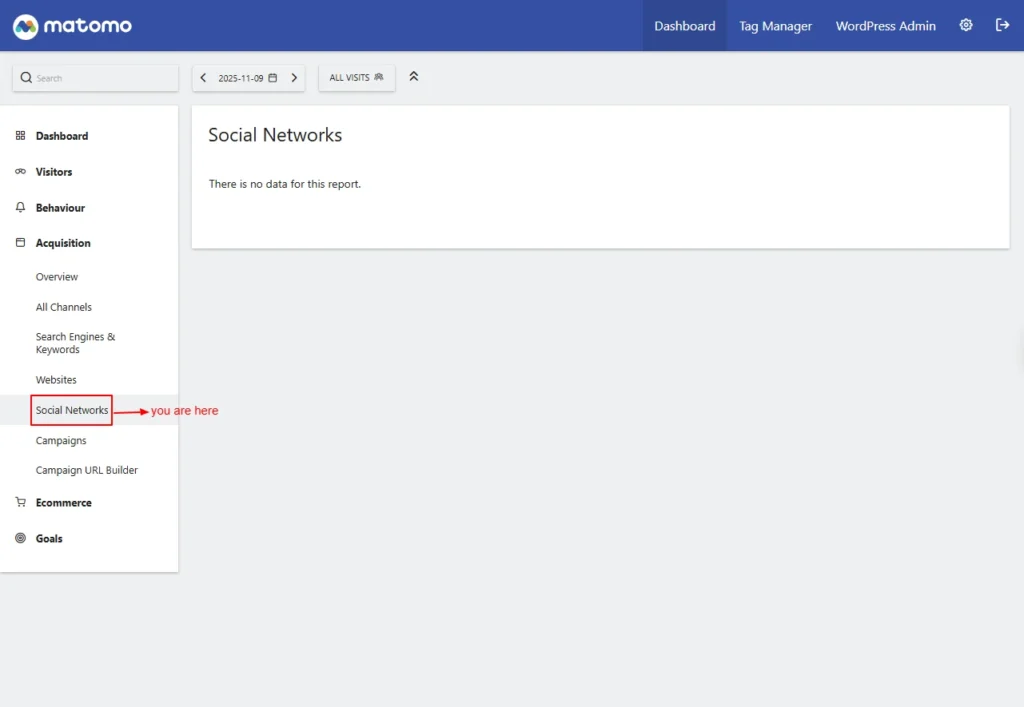
Screenshot 18: Acquisition → Social Network
Campaigns
Shows visits generated through marketing campaigns tracked using campaign parameters.
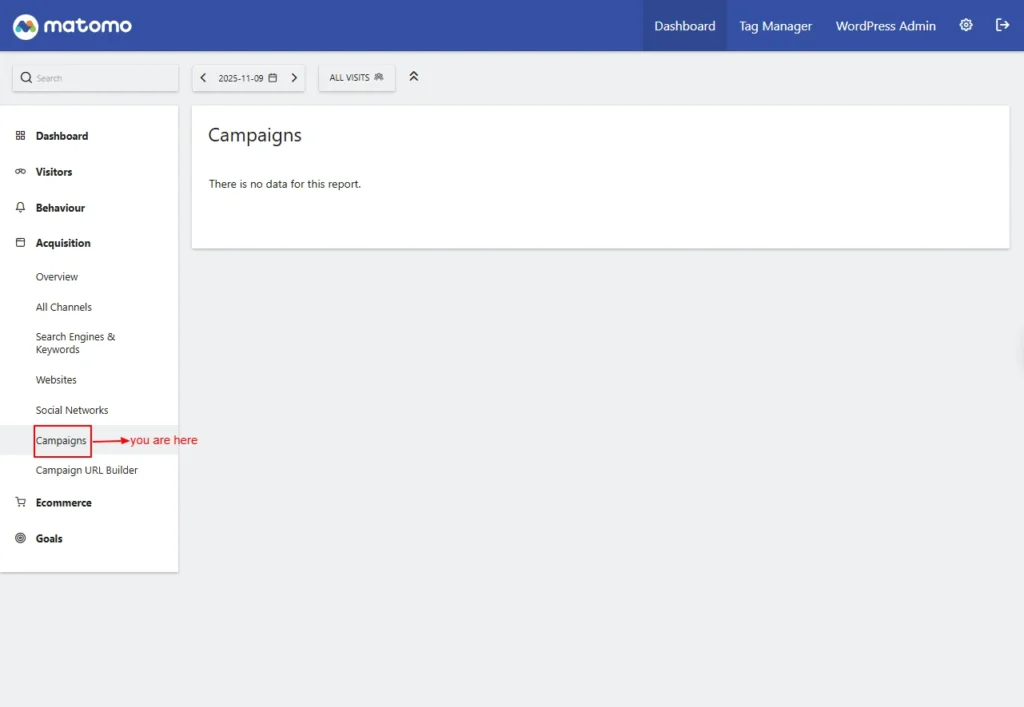
Screenshot 19: Acquisition → Campaigns
Campaign URL Builder
A tool to create trackable URLs for measuring campaign performance in Matomo.
- Page URL: The landing page address where users will arrive through the campaign.
- Campaign Name: A unique identifier used to label and differentiate the campaign.
- Campaign Keyword: An optional tag to classify or distinguish multiple campaigns under the same campaign name.
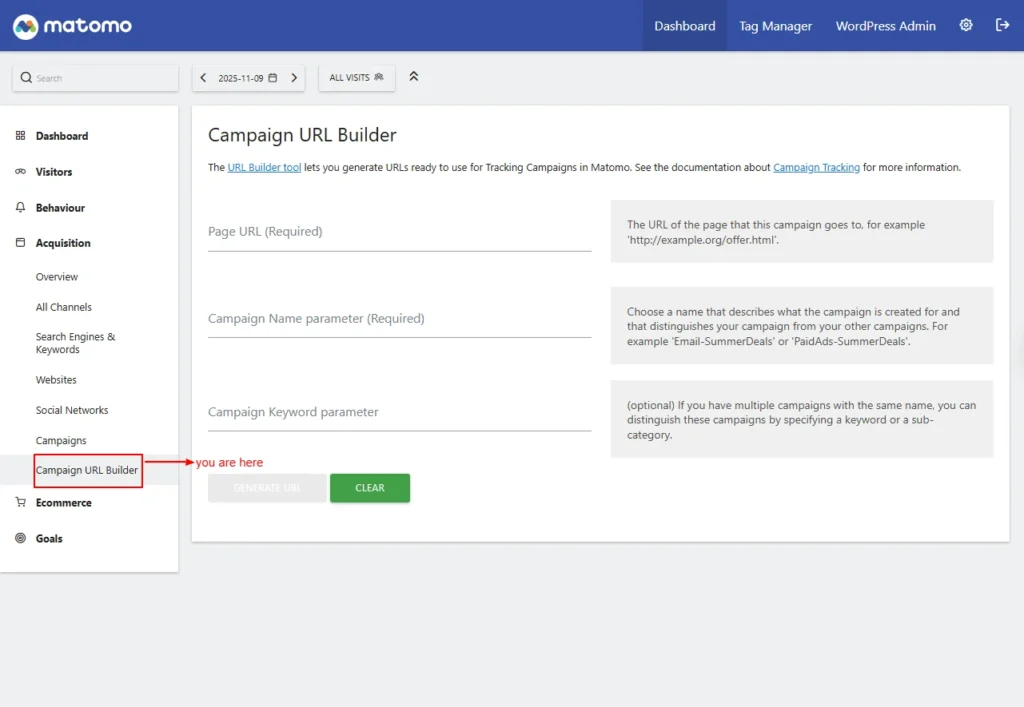
Screenshot 20: Acquisition → Campaign URL Builder
E-commerce
The E-commerce settings allow you to enable and configure tracking for online sales, product views, and customer actions to measure your store’s performance.
| Note: This blog was written specifically for website tracking, not e-commerce (hence, no data available in the reports). However, we’ve included the basics for continuity with the Matomo WordPress plugin dashboard. E-commerce tracking is more advanced and will require a dedicated blog. |
Overview
The E-commerce Overview shows key sales metrics, product performance, and customer behaviour to help you monitor and optimize your online store’s results.
- Evolution over the period: This graph shows a snapshot of the conversions generated for a specific goal. A selected date range.
- The widget card shows the following data:
- E-commerce Orders: Total orders placed during the selected period.
- Total Revenue: The overall revenue generated from completed orders.
- Average Order Value: The average value of each completed order.
- E-commerce Orders Conversion Rate: Percentage of visits that resulted in an order.
- Purchased Products: Total number of items bought.
- Abandoned Carts: Carts created but not completed.
- Visits with Abandoned Cart: Total visits where a cart was abandoned.
- Revenue Left in Cart: Total value of abandoned carts.
- Visits with Abandoned Cart: The percentage of visits that resulted in cart abandonment.
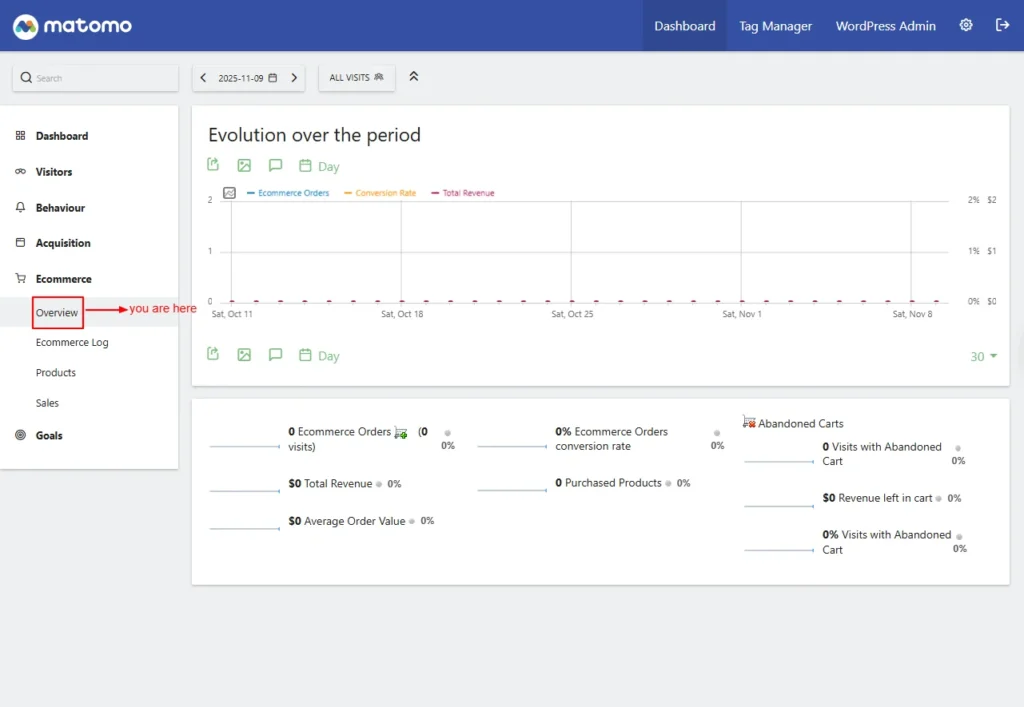
Screenshot 21: E-Commerce → Overview
E-commerce Log
Displays a detailed list of all e-commerce actions and transactions recorded on your site.
- Order & Cart Activity: Shows individual orders, abandoned carts, and related visitor interactions.
- Visitor-Level Insights: Let you review which users purchased, what they viewed, and how they reached checkout.
- Product & Revenue Details: Includes product names, revenue generated, quantities, and order values.
Note: Since e-commerce is not considered for this blog, there is no data to display.
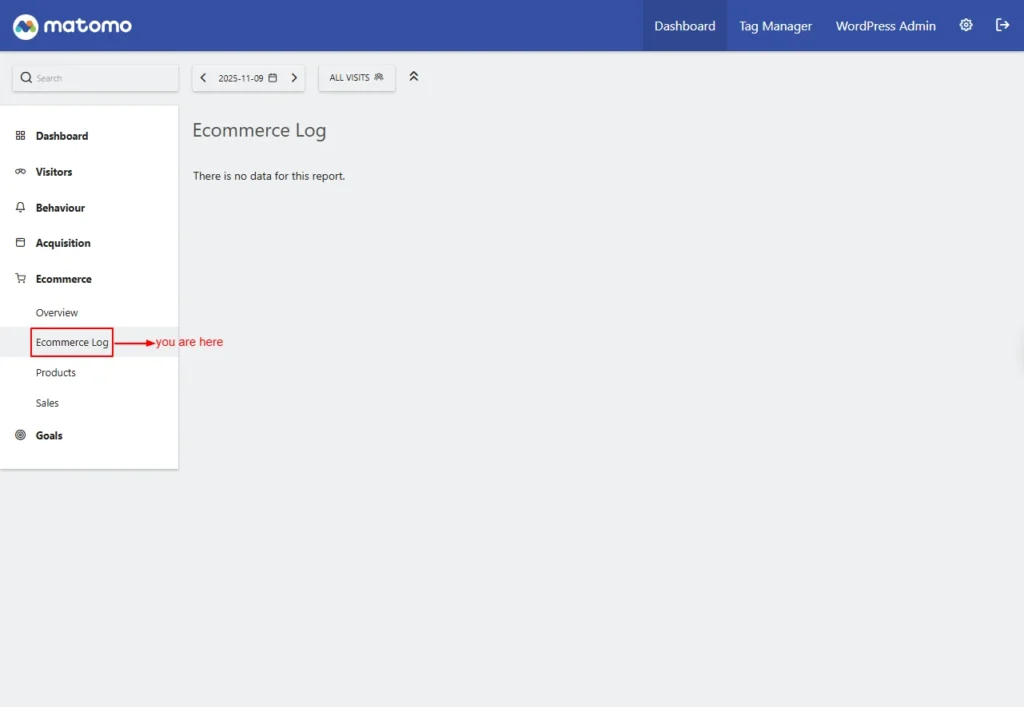
Screenshot 22: E-Commerce → E-Commerce Log
Products
Displays detailed statistics for each product sold or viewed on your site.
- Product Name: Lists all products with metrics like views, purchases, and revenue.
- Product SKU: Tracks e-commerce performance using unique product identifiers.
- Product Category: Group products by category to analyse which sections perform best.
- Performance Insights: Helps understand popular products, sales trends, and conversion rates.

Screenshot 23: E-Commerce → Products
Sales
The Sales settings let you track completed orders, revenue, and transaction details so you can measure your store’s overall sales performance.”
Sales by Referrers
Shows which traffic sources (direct, search, campaigns, websites, social) led to purchases.
- Channel Type: Breaks down revenue by acquisition channel, such as direct, search, referral, or campaigns.
- Keywords: Shows search keywords that resulted in sales.
- Search Engines: Displays which search engines drove visitors who made purchases.
- Websites: Shows external websites that referred users who completed a purchase.
- Campaigns: Tracks sales generated from marketing or advertising campaigns.
Sales by Pages
Shows which pages generate sales and how much revenue each page contributes.
- Page URLs: Lists the pages customers viewed before converting and tracks revenue per page.
- Entry Pages: Shows the first page users viewed before making a purchase.
- Entry Page Titles: Displays product-related page titles that started a converting visit.
- Page Titles: Shows page titles associated with purchases and the total revenue influenced.
Sales Engagement
Shows how visitors interact with your products, including views, cart actions, and purchase behaviour.
- Visits to Conversion: Shows how many visits it took for a user to convert.
- Days to Conversion: Displays the time (in days) from first visit to purchase.
Sales by User Location
Shows sales performance based on where your customers are located, including countries, regions, and cities.
- Country / Continent / Region / City: Breaks down sales performance by geographical location to identify strong markets.
- Device Type: Which devices (desktop, mobile, or tablet) did users purchase from?
- Device Model: Identifies specific device models that generated sales.
- Device Brand: Shows which device manufacturers drove e-commerce conversions.
- Browsers: Displays visitor browser types that resulted in purchases.
Sales by User Attribute
Shows sales grouped by customer attributes such as user roles, segments, or defined profile characteristics.
- Visits per hour in the site’s timezone: Shows at what hours sales typically occur.
- Channel Type: Shows which user attributes contributed to sales (e.g., traffic source). No data may appear if tracking has not yet captured e-commerce conversions.

Screenshot 24: E-Commerce → Sales
Goals
Allows you to create and manage goals to track important visitor actions such as sign-ups, downloads, purchases, or form submissions.
Overview
The Goals Overview provides insights into how each of your website’s goals is performing. It displays conversion rates and total revenue generated and gives you access to detailed reports for every goal.
- Evolution Over the Period: This graph shows how goal completions and revenue change over a selected timeframe.
- The card widgets show.
- Conversions: Displays the total number of times defined goals were completed.
- Overall Revenue: Shows total revenue generated from goal completions.
- Overall Conversion Rate: Indicates the percentage of visits that completed at least one goal.
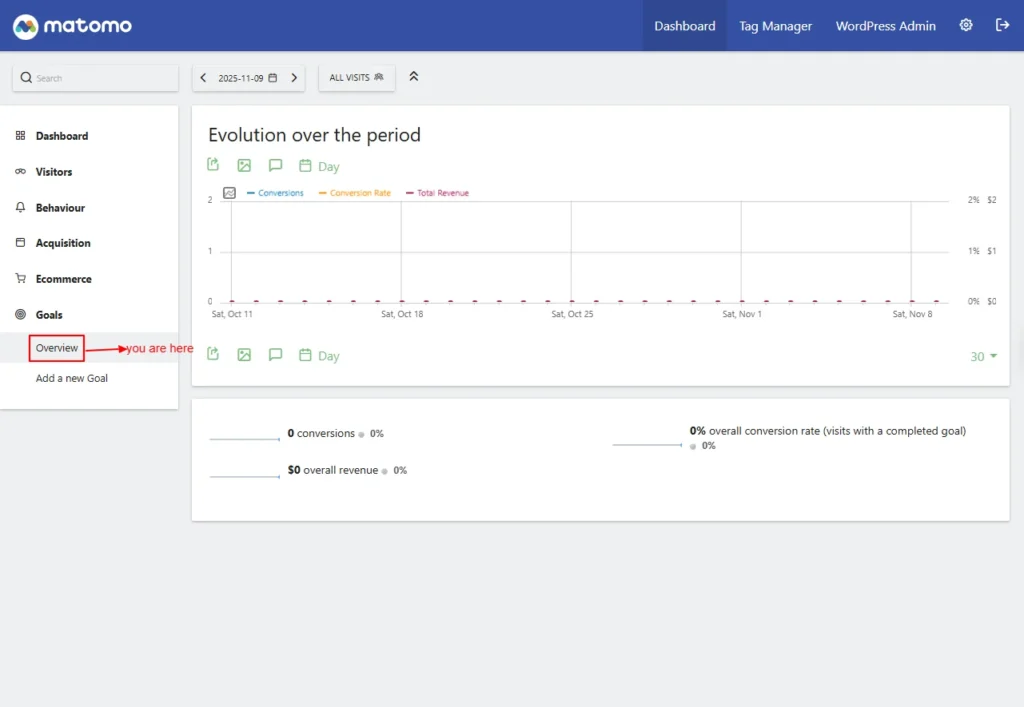
Screenshot 25: Goals → Overview
Add a New Goal
Create a new conversion objective to measure important visitor actions.
- Goal Name: Enter a title to identify the goal (e.g., “Newsletter Signup”).
- Description: Optional text explaining the purpose of the goal.
- Goal is Triggered When: Defines what visitor action should count as a conversion.
- when visitors (do some action)
- manually
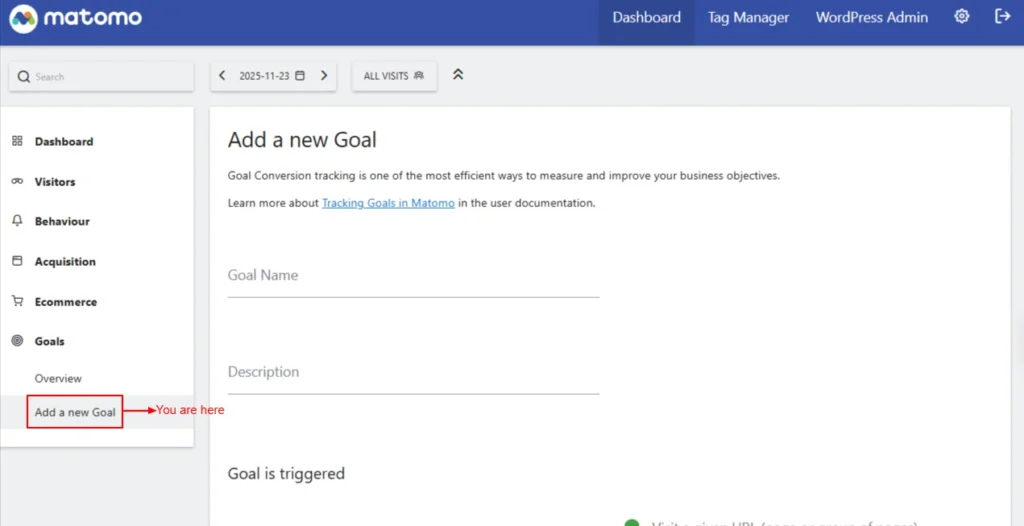
Screenshot 26: Goals → Add a new Goal
When Visitors
- Visit a given URL (page or group of pages)
- Contains: add the pattern for the URL.
- is exactly
- matched by the expression
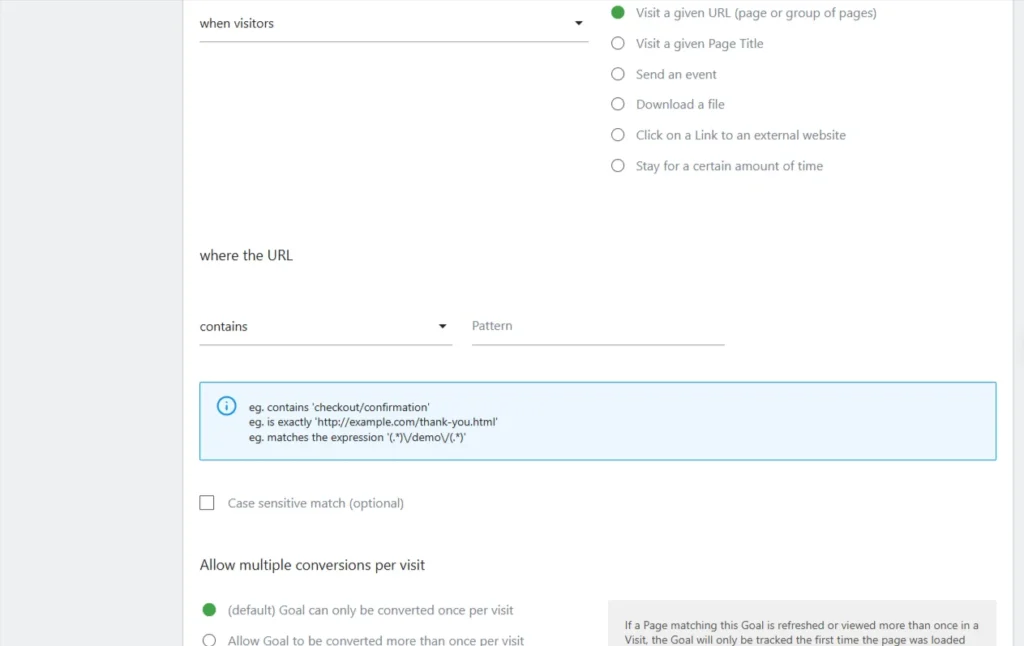
Screenshot 27: When Visitors → Visit a given URL
- Visit a given Page
- Where the Page title
- contains: add the pattern for Title
- is exactly
- matches the expression
- Where the Page title
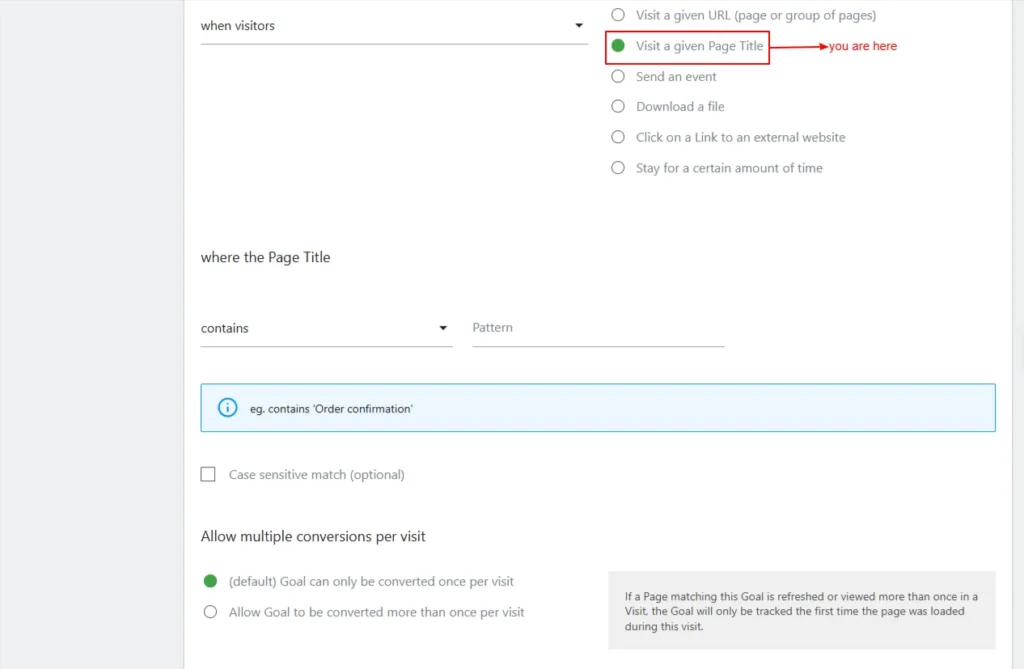
Screenshot 28: When Visitors → Visit a given page title
- Send an event
- Where the
- Event category / Event Action / Event Name
- Contains (‘video’: Triggers when “video” appears in the event category)
- is exactly (‘’click’: triggers only if the event category matches the exact word click.)
- matches the expression (‘(.*)_banner’: uses regex to match advanced event) patterns.
- Where the
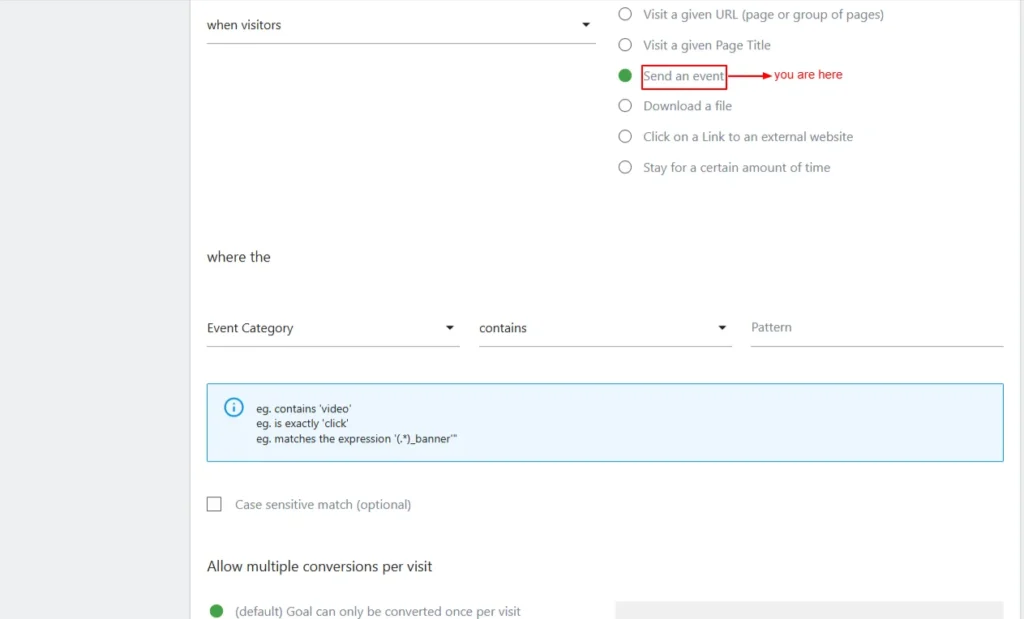
Screenshot 29: When Visitors → Send an event
- Download a file
- Where the filename
- contains (files/brochure.pdf’: triggers when visitors download a file containing this path or name)
- is exactly (‘http://example.com/files/brochure.pdf’: triggers only if the file URL is an exact match.)
- matches the expression (‘(.*)\.zip’: uses regex to match any .zip file download.)
- Where the filename

Screenshot 30: When Visitors → Download a file
- Click on a link to an external website
- where the external website URL
- Contains (‘amazon.com’: tracks outbound clicks to Amazon-related links).
- is exactly (‘http://myaffiliate.com/landing.html’: tracks clicks only to this exact URL.)
- matches the expression (‘http://www.amazon.com/(.*)/yourAffiliateId’: uses regex to match affiliate or structured outbound URLs.)
- where the external website URL
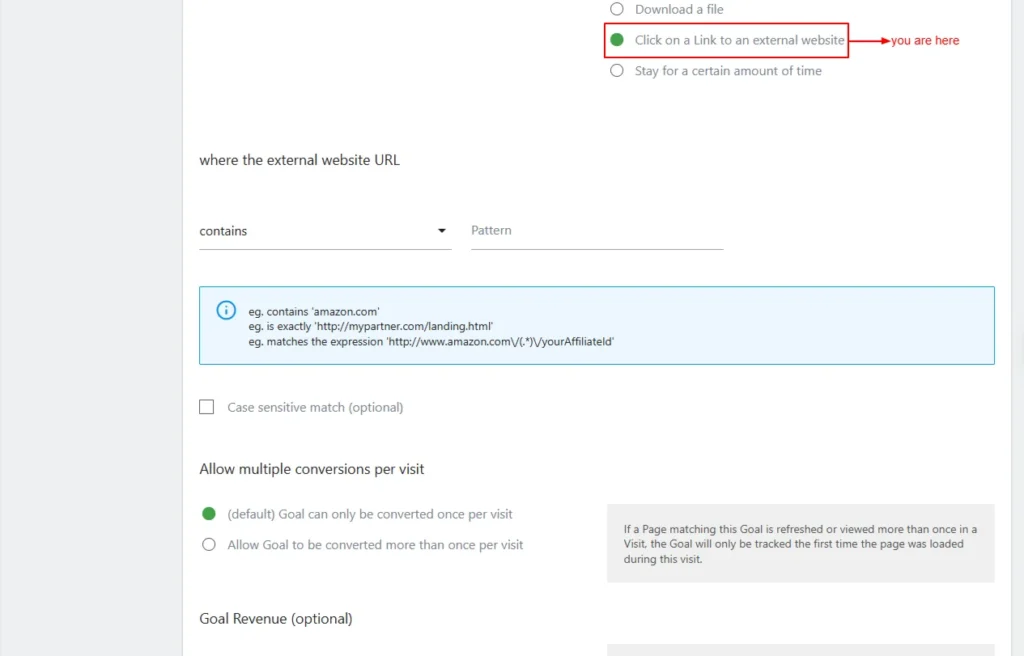
Screenshot 31: When Visitors → Click on a Link to an External Website
- Stay for a certain amount of time
- where the visit duration is
- Greater than time in minutes
- Example: Enter 5 to trigger a conversion after 5 minutes. Supports decimals. e.g., 0.5 = 30 seconds
- Greater than time in minutes
- where the visit duration is
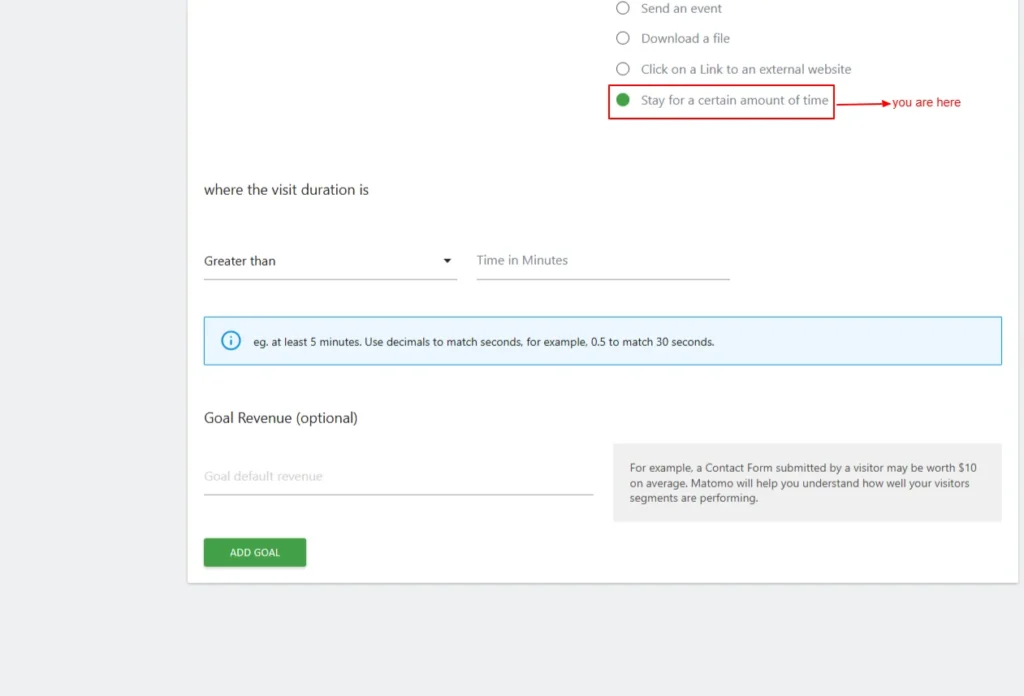
Screenshot 32: When Visitors → Stay for a certain amount of time
Manually
Let’s you trigger the goal manually. You must add trackGoal() in your site’s JavaScript to record the conversion event.

Screenshot 33: The goal is triggered manually
- Case-sensitive Match (optional): Matches the URL exactly as typed, treating uppercase and lowercase letters as different values.
- Allow multiple conversions per visit.
- Goal can only be converted once per visit (default): Let the same visitor trigger a goal more than once during a single session.
- Allow Goal to be converted more than once per visit: Goal will be tracked for every time the page is loaded during the visit.
- Goal Revenue (optional): Assigns a monetary value to each completed goal for revenue reporting.
- Example: A whitepaper download could be valued at $50 for lead-generation measurement.
Tag Manager
| Note: This blog was written specifically for the Matomo basic analytics setup. Matomo Tag Manager is advanced and would require a dedicated blog to explore all the functionality in it. Still, we have covered just the basics of containers in the upcoming section. |
Manage Containers
With Matomo Tag Manager (MTM), you can update your tracking configurations without modifying your website’s code. These configurations are stored in containers. Typically, one container is used per site, but you can create multiple containers for complex setups involving multiple domains or teams. Matomo automatically sets up the first container for your site.
This section lists all your containers with their ID, name, description, and creation date, along with quick actions to manage or edit each container.
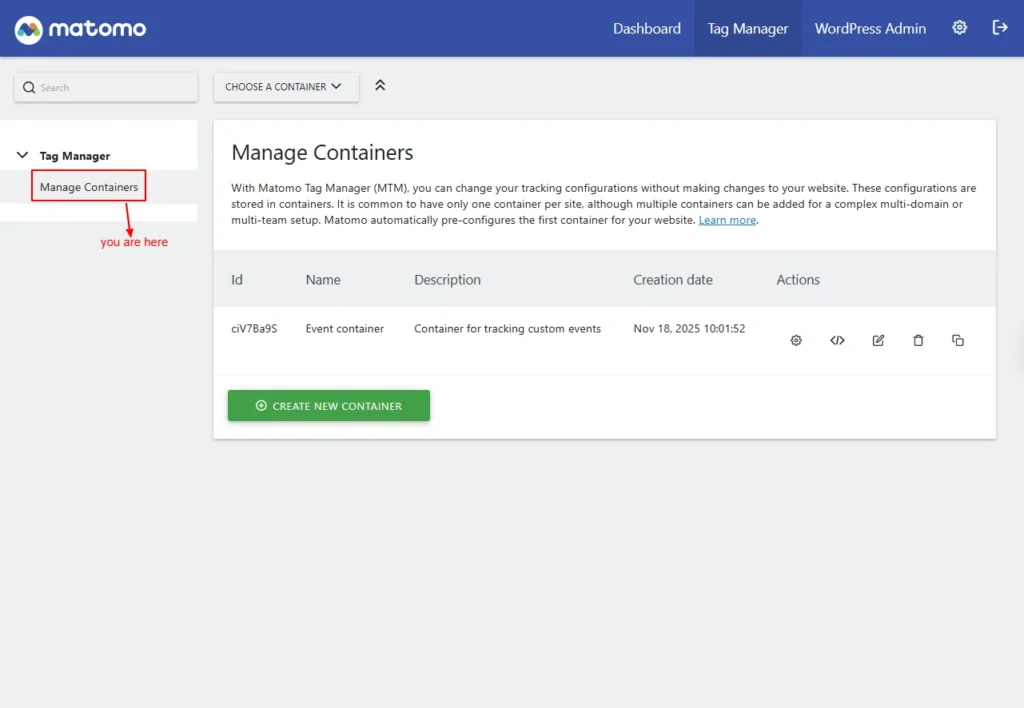
Screenshot 34: Tag Manager → Manage Containers
Click On Create New Container
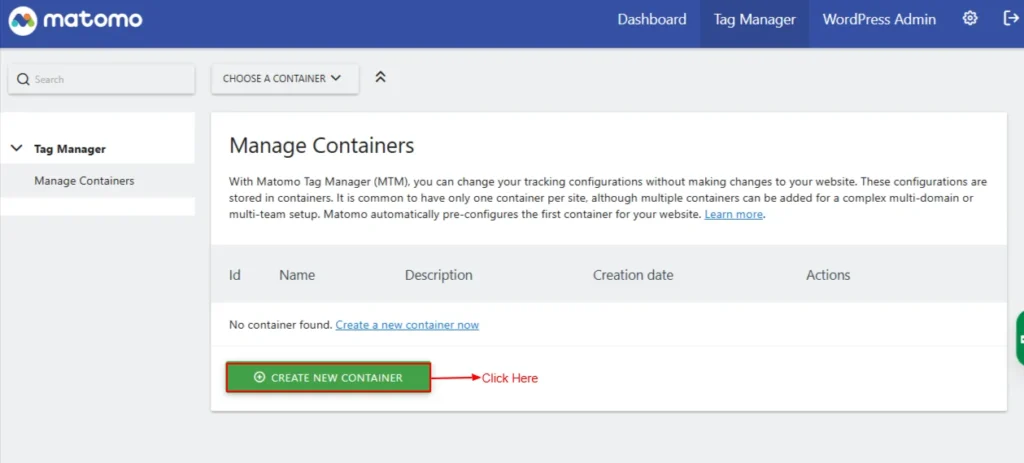
Screenshot 35: Manage Containers → Click on Create New Container
- Context: Web
- Specifies the context in which the container will be used. Currently, only “Web” containers are supported.
- Name: The name of the container
- Set a unique identifier for this container. Note that this name can be accessed as a variable and is publicly visible in the analytics tag’s source code.
- Description (Optional): The description of the container
- You can optionally add a description to explain the purpose of this container, which is particularly helpful when managing multiple containers on a single site.
- Ignore Google Tag Manager Data Layer: (Check / Uncheck)
- When enabled, Matomo Tag Manager will ignore data layer values previously defined by Google Tag Manager. By default, these values are retained for compatibility purposes.
- Actively Synchronise From the Google Tag Manager Data Layer: Check/Uncheck
- When enabled, any new values added to the Google Tag Manager data layer will automatically sync with the Matomo Tag Manager data layer.
- Enable tag fire limits to work in preview mode: Check/Uncheck
- Enable this option to check if fire limits, such as once-per-lifetime, work as expected when preview mode is enabled.
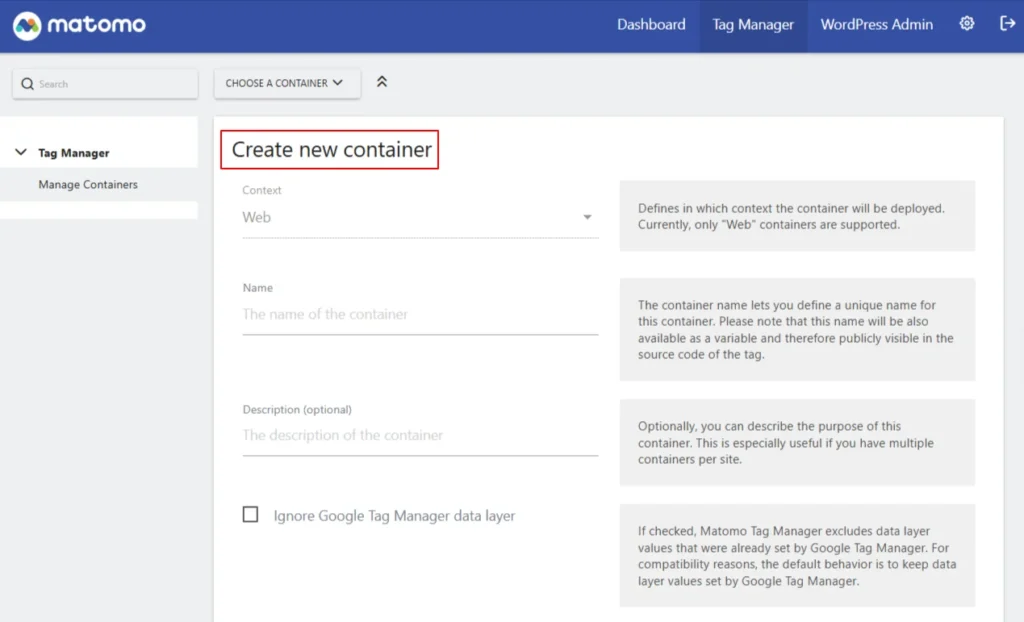
Screenshot 36: Manage Containers → Create a new container
Settings (WordPress backend)
| Note: There are two settings: one in the WordPress backend dashboard (Matomo Analytics → Settings) and one in the Matomo Analytics admin dashboard. We are discussing the first one in the upcoming section. |
Tracking
Here you can customize how visit tracking works on your site. You can either enable tracking using the default settings or adjust the configuration to fit your needs.
Tracking Mode Options:
- Auto (Recommended): Matomo automatically generates and embeds the tracking code based on your Auto Tracking settings. This is the best option for most users.
- Manual: Write your own custom tracking JavaScript below, and Matomo will insert it into your website.
- Tag Manager: If you’ve created containers in the Tag Manager, you can use this mode to automatically embed one or more of them on your site. This option will only be available once containers exist.
- Disabled: Matomo won’t add any tracking code. Choose this if you prefer to insert the tracking code manually into your template files or use another plugin for e-commerce.
![]()
Screenshot 37: Settings → Tracking
General Tracking Settings
Here you can adjust visit tracking as you prefer, or just enable tracking and use the default settings.
Tracking mode:
You have to select one of the following
- Auto (recommended): Select/deselect
- Manual: Select/deselect
- Tag Manager: Select/deselect
- Disabled: Select/deselect
These settings apply to all tracking modes unless specified otherwise.
E-commerce Tracking
E-commerce Tracking enables Matomo to record product views, cart updates, and completed orders, giving you detailed insights into your store’s sales activity.
Enable E-commerce
Turn this on to track e-commerce activity, such as orders and abandoned cart views, for platforms like WooCommerce, Easy Digital Downloads, MemberPress, and others. Disabling this option will stop e-commerce and remove related reports from Matomo.
Currency: The Options are
- Us Dollar
- Euro
- Japanese yen
- British pound and many more
Choose the currency to display in your reports. This currency is used for e-commerce data and for goals that include a monetary value.
Use Server-Generated Visitor ID: Enable/Disable
- When enabled, Matomo will assign a temporary server-generated visitor ID if no Visitor ID cookie is found. This ensures e-commerce events are correctly linked to visits, even when cookies are blocked or cookieless tracking is active. The ID remains valid only for that session.
Note: This setting won’t work properly if you use Varnish or another caching system, as it initializes the WooCommerce session early for visitors without a Visitor ID cookie.
Importantly, this feature may not comply with some privacy regulations that require user consent before creating an initialized ID or tracking e-commerce events.
Other Tracking
Other Tracking provides additional options to record extra visitor actions and behaviours, giving you more flexibility in how analytics data is collected.
- Track Admin Pages: Enable/Disable
- Enable this option to track user activity within the WordPress admin area. Be sure to configure the tracking filter to suit your needs.
- Track WordPress User ID:
- When enabled, Matomo records the logged-in user’s “User ID.” You can choose which field from the user’s profile should be used as the ID. The options to choose from are
- WP User ID
- Email Address (The user might change their email address.)
- User name (chose this since this is unique for every user in WordPress)
- Display Name (Not recommended)
- When enabled, Matomo records the logged-in user’s “User ID.” You can choose which field from the user’s profile should be used as the ID. The options to choose from are
- Track Search:
- Activate Matomo’s advanced Site Search Analytics to monitor what visitors search for on your website.
- Track 404 Pages:
- Matomo can automatically categorize and track visits to “Page Not Found” (404) errors to help you identify broken links.
- Track RSS Feeds:
- Enable this setting to insert a tracking pixel that monitors how often your posts are viewed in RSS feed readers.
- Track RSS Feed Links as Campaigns:
- Adds Matomo campaign parameters to links in your RSS feeds so you can track traffic coming from those links more accurately.
Create Matomo annotations on a new post of type:
This option automatically creates Matomo annotations whenever a new post of the selected type is published, helping you track content-related events in your analytics.
- Posts
- Pages
- Media
- Revisions
- Navigation Menu Items
- Custom CSS
- Changesets
- oEmbed Responses
- User Requests
- Patterns
- Templates
- Template Parts
- Global Styles
- Navigation Menus
- Font Families
- Font Faces
- Taxonomies
- Custom Post Types
Advanced
The Advanced settings let you fine-tune technical tracking options, offering more control over how Matomo collects and processes analytics data.
- Add <noscript → to track visitors without JavaScript: Enable/Disable.
- Adds a <noscript → tracking code to your site’s footer. This code is automatically generated or can be manually defined, depending on your selected tracking mode. It helps capture visits from users who have disabled JavaScript.
Note: This option does not apply when using the Tag Manager tracking mode.
![]()
Screenshot 38: Settings → Tracking → General Tracking Settings
Conclusion
Exploring Matomo’s advanced reporting features gives you a complete, data-rich understanding of how visitors behave on your WordPress site.
In this part, we covered the full set of behaviour, acquisition, e-commerce, and goals reports that help you evaluate performance, identify opportunities, and measure your most important outcomes.
You now have a deeper view into the following:
- Behaviour Reports
- Acquisition Reports
- E-commerce Reports
- Goals & Conversions
- Tag Manager
- Settings
With these insights, your analytics setup is no longer just tracking data; it’s providing real intelligence that helps you optimize your website experience, refine your content strategy, strengthen your marketing efforts, and increase conversions.
Now that your behaviour and performance tracking foundation is in place, it’s time to move into Part 3, where we’ll explore the full power of Matomo’s advanced tools and administrative settings.
Published on Dec 10, 2025 | Updated on Dec 26, 2025