Introduction
Matomo for WordPress is an official plugin that brings Matomo’s open-source, privacy-focused web analytics directly to your site.
It allows you to collect and view visitor data under your control (hosted on your server or Matomo Cloud), ensuring you maintain ownership of analytics data, manage retention and privacy settings, and avoid sending raw user data to third-party platforms.
Key Features Of Matomo Plugin
- Data ownership & hosting options: Host analytics on your WordPress site, on a separate self-hosted Matomo server, or use Matomo Cloud so you control the data.
- Integrated dashboard & WP admin widgets: view core reports and KPIs inside your WordPress admin without switching tools.
- Real-time visitor tracking: See live visits, active pages, referrers, and locations as they happen.
- Pageviews, events & custom dimensions: Track pageviews, clicks, downloads, and custom events, and add custom dimensions for richer segmentation.
- Goals & conversion tracking: define goals (form submit, URL, events) and measure conversion rates and funnels.
- E-commerce tracking tracks product views, cart actions, transactions, revenue, and product-level metrics.
- Funnels & A/B testing: build conversion funnels and run experiments to optimize user journeys.
- Heatmaps & session recordings: visualize where users click/scroll and replay sessions to spot UX issues (optional modules).
- Form analytics: analyze form interactions, drop-offs, and field-level friction.
- Privacy & compliance controls: IP anonymization, cookie controls, tracking opt-out, and settings to help meet GDPR/CCPA requirements.
- Consent manager and cookie handling ability to respect consent banners and conditionally enable tracking based on user consent.
- APIs, developer hooks & plugin integrations: REST APIs, WP filters/actions, and integrations so themes/plugins can send custom data or extend Matomo.
- Multi-site & user permissions support for multisite setups and role-based access to analytics data.
- Reporting & export: scheduled reports, CSV/PDF exports, and custom report creation.
- Performance/configuration options to disable cookies, reduce data retention, and tune which modules run to limit server load.
In this part, we’ll walk you through the essential steps you need to get right. Here’s what we’ll cover:
- How to install the Matomo Plugin in WordPress
- A step-by-step guide to installing, activating, and configuring Matomo correctly.
- Get Started
- Initial setup, first-time configuration, and important settings every site should enable.
- Update your privacy page.
- Why your Privacy Policy must be updated, and how Matomo helps you stay compliant.
- Enable tracking
- How to activate visitor tracking, verify that Matomo is recording data, and avoid common setup mistakes.
After the setup, we’ll also walk through what you can do inside Matomo, including:
- Summary Reporting
- A top-level view of your key metrics and website performance.
- Visitors Reports
- Overview
- Visits Over Time
- Visits Overview
- Understand total visits, engagement metrics, patterns, and behaviour trends.
- Visits Log
- See detailed session-level visitor data.
- Real-time Tracking
- Real-time dashboard
- Locations
- Where your visitors come from and which regions drive the most engagement.
- Devices
- Breakdown of devices, screen sizes, and user technology.
- Software
- See which browsers, operating systems, and technologies your audience uses.
- Times
- Insights into peak activity hours and user behaviour throughout the day.
- User IDs
- Track logged-in users (optional) for deeper analytics and behavioural insights.
So let’s get started.
How to install the Matomo Plugin in WordPress
Go to the WordPress Dashboard of your website.
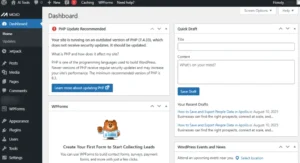
Screenshot 1: Dashboard of WordPress
From the left-hand navigation menu, go to the Plugin menu and click on it.
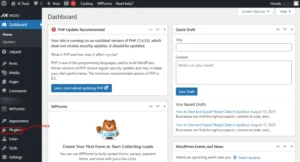
Screenshot 2: Plug-in Menu
You will see a Plugins Dashboard. Click on Add plugin.
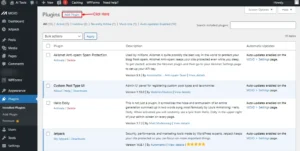
Screenshot 3: Add a Plugin
Search for the Matomo plugin in the Add Plugin screen
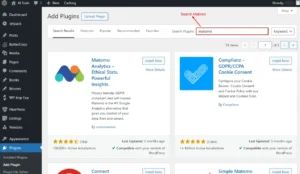
Screenshot 4: Search for Matomo Plugin
Click on Install Now in the Matomo Plugin.
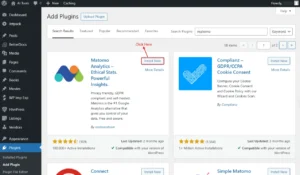
Screenshot 5: Install Now Plugin
Click on the Activate Button.
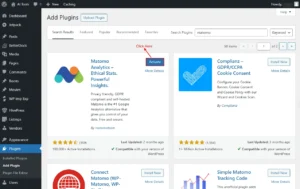
Screenshot 6: Activate Matomo plugin
After installing the Matomo Plugin, you will see the menu of Matomo Analytics menu in the left-hand navigation.
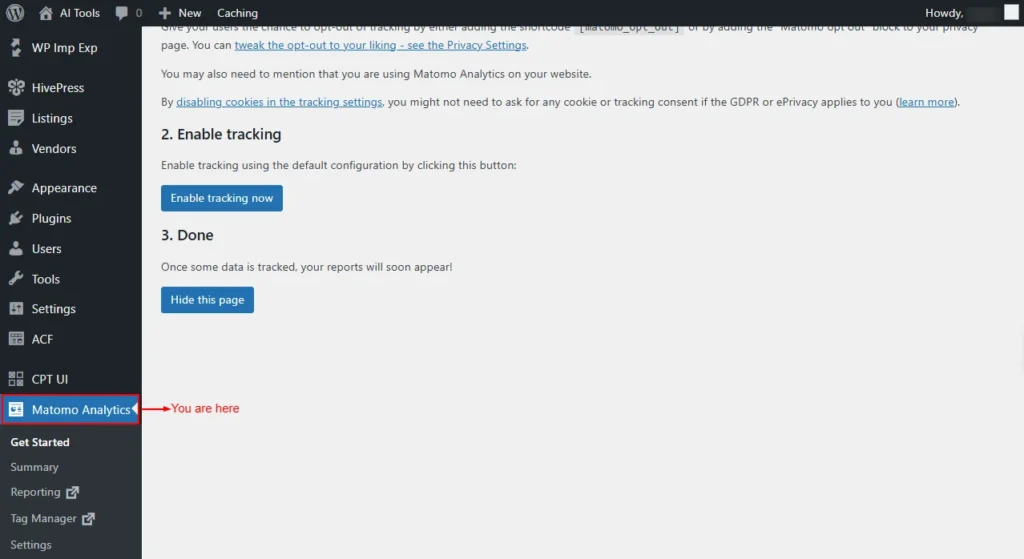
Screenshot 7: Matomo Analytics
Navigate to the Matomo plugin’s dashboard.
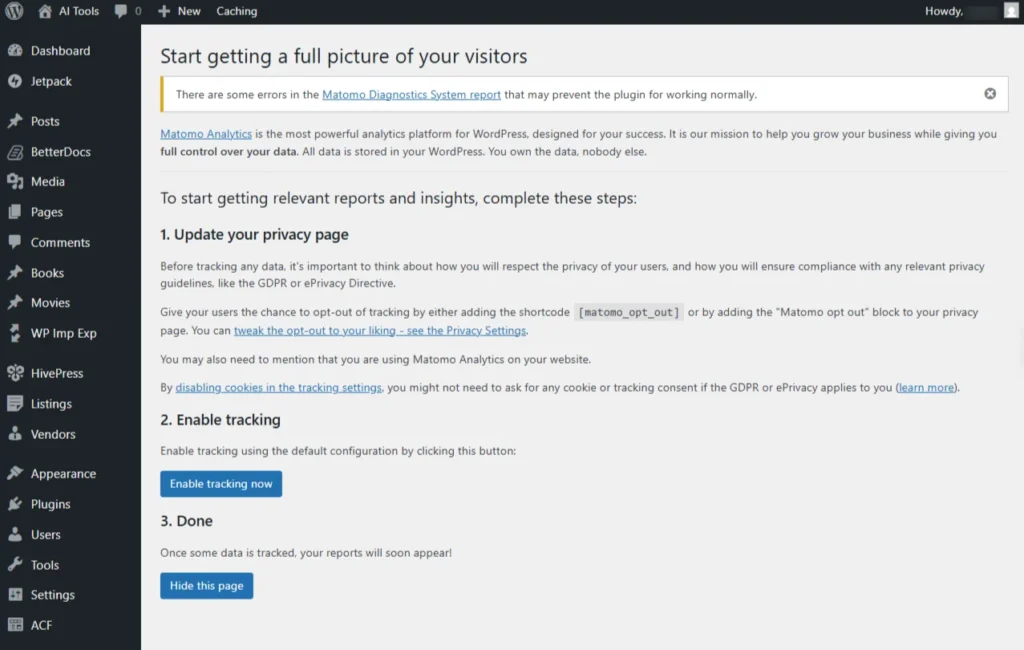
1. Get Started
This menu lists all the steps required for getting started using the Matomo plugin.
Update your privacy page
Before you begin tracking, you have to update your privacy page with information about how you will respect user privacy to comply with laws like the GDPR or ePrivacy. You may also need to mention that you are using Matomo Analytics by having an Analytics section on your privacy page.
Next, provide your visitors with an easy opt-out option by adding the [matomo_opt_out] shortcode to your privacy page or using the Matomo opt-out Gutenberg block.
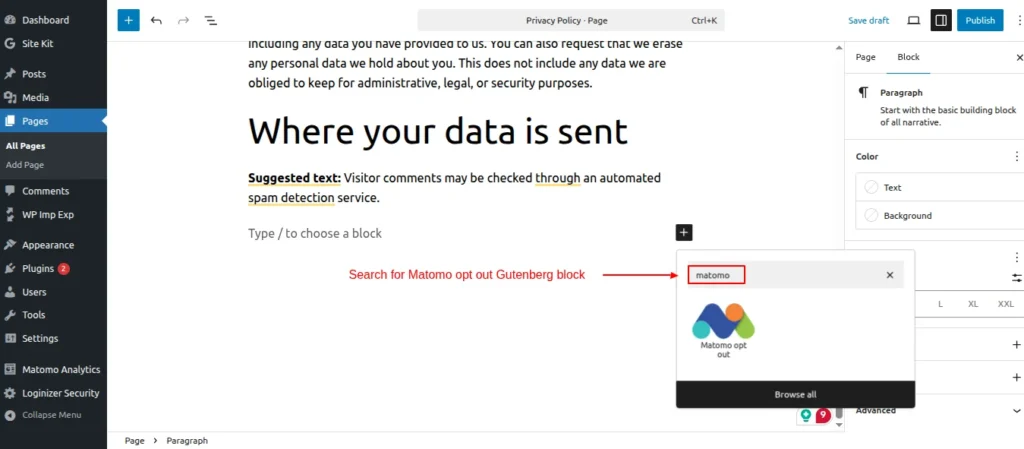
Screenshot 8: Matomo opt-out Gutenberg block
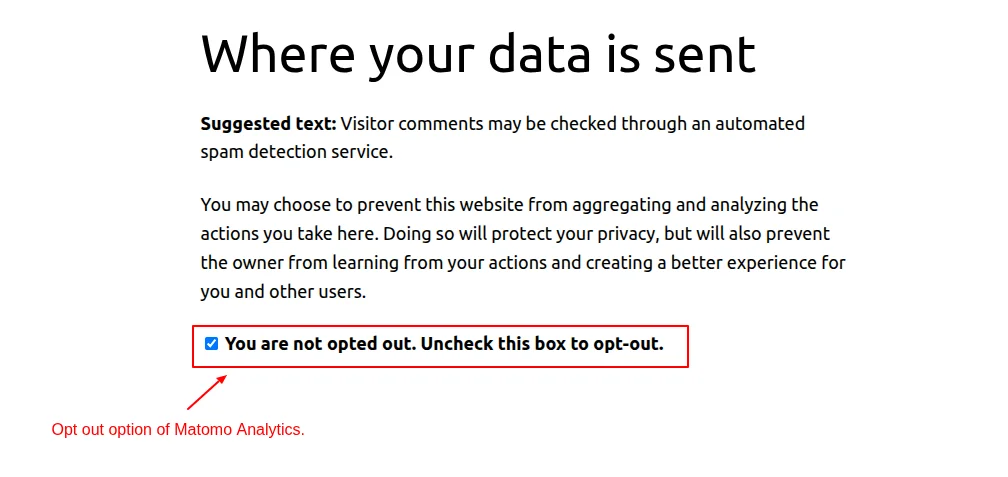
Screenshot 9: Matomo opt-out option added to privacy page
Note: If you disable cookies in the tracking settings (it will be discussed later), you may not need to request cookie consent under GDPR/ePrivacy
Enable tracking
Turn on tracking using the default configuration by clicking the Enable tracking button.
![]()
Screenshot 10: Enable Tracking Now
Once the button is clicked, you will see a message: Tracking is enabled.
![]()
Screenshot 11: Tracking Is Enabled
This means your tracking is up and running: no further setup is needed. If you’d like, you can click here to customize the tracking code, though it’s completely optional. After some visits are recorded, your reports will appear in the dashboard.
At this step. We will be discussing this in depth in the upcoming section.
Screenshot 12: Dashboard Of Matomo Plugin
You can hide this page (Getting Started menu) once all the Getting Started steps are completed.
2. Summary
This menu gives a bird’s-eye view of all the metrics that are tracked by Matomo Analytics.
- Country: Shows where your visitors are located geographically.
- Device type: Identifies whether users visit from desktop, mobile, or tablet devices
- Screen Resolution: Displays the screen sizes and resolutions your visitors use.
- Browsers: Lists the web browsers your audience uses to access your site.
- Page titles: Report analytics based on individual page titles viewed by users.
- Exit page titles: Shows the pages where visitors most often leave your site.
- Outlinks: Tracks clicks on links that lead users to external websites.
- Social Networks: Displays traffic and engagement coming from social media platforms.
- E-commerce Orders: Tracks online sales, transactions, and order details.
- Visits Summary: Provides an overview of total visits, unique users, and key metrics.
- Actions-main Metrics: Measures user actions such as pageviews, clicks, and events.
- Goals: Tracks how often visitors complete defined objectives like signups or purchases.
- Operating System Families: Identifies the operating systems visitors use (e.g., Windows, iOS, Android).
- Visits per hour in the site’s timezone: Displays visit trends across different hours of the day.
- Entry page titles: Shows which pages visitors first land on when entering your site.
- Downloads: Tracks files or documents downloaded from your website.
- All Channels: Summarizes traffic sources such as direct, search, social, and referrals.
- Campaigns: Measures visits and conversions generated by marketing campaigns.
- Product Name: Displays performance data for each product in your e-commerce tracking.
You can change the date to view the summary accordingly. Here are the following options:
- Yesterday
- Today
- This week
- Last week
- This month
- Last month
- This year
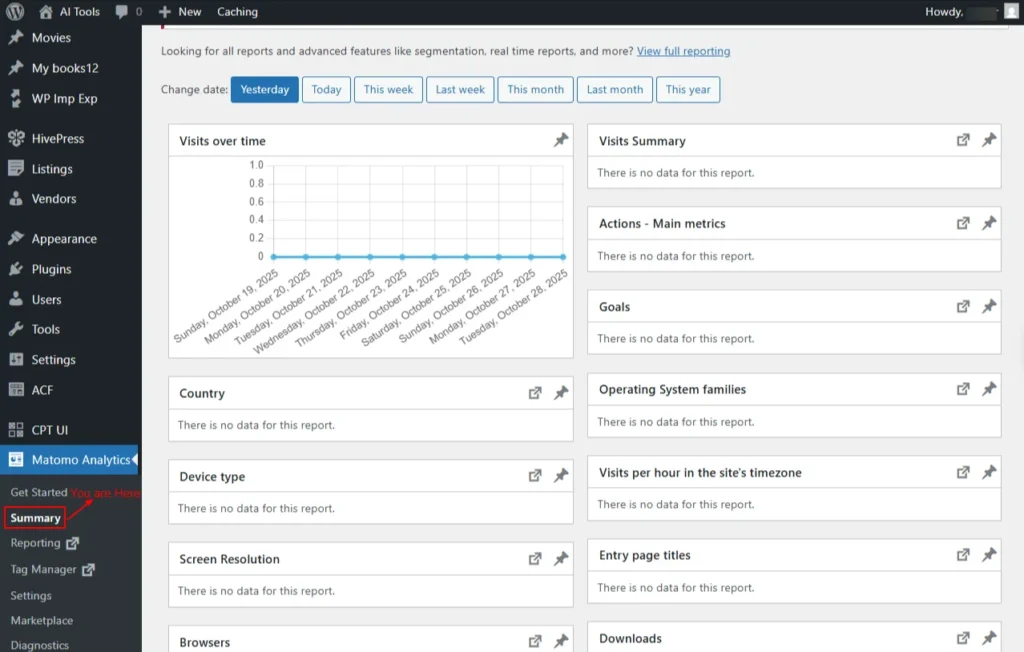
Screenshot 13: Matomo Analytics Summary
3. Reporting
The Reporting section provides detailed insights into your website’s traffic, visitor behavior, and performance metrics, helping you analyze and understand your site’s analytics in one place.
This menu will open the Matomo plugin’s dashboard in a new tab.
It will show the following cards.
- Visits in real time: Displays live visitor activity on your website in real time.Click on View detailed visit log.
- Welcome card: You can view all Matomo video tutorials. You can close this widget anytime by clicking the ‘X’ icon at the top.
- Visits Over Time: Shows the number of visits to your website over a selected period of time.
- The following are the Metrics available to plot
- Visits
- Unique visitors
- Users
- Avg. Visit Duration (in seconds)
- Bounce Rate
- Actions per Visit
- Maximum actions in one visit
- Visits with Conversions
- Pageviews
- Unique views
- Downloads
- Unique Downloads
- Outlinks
- Unique Outlinks
- Avg. generation time
- Searches
- Unique keywords
- Also, you can view data by day, week, month, and year.
- The following are the Metrics available to plot
- Movers and Shakers: Shows which pages, campaigns, or keywords have experienced the biggest changes in traffic or performance compared to a previous period.
- Visits Overview: The Visits Overview card provides a quick snapshot of your key visitor metrics for whatever date range you’ve selected. Instead of diving into full reports, you get the essentials right at a glance.
- Each metric is paired with a mini trend line that shows how that metric has behaved over time.
- The blue dot marks the peak, the day or moment traffic was strongest.
- The orange dot shows the low point, where activity dipped.
- These tiny visual cues make it easier to understand performance patterns instantly, without needing to interpret a large chart.
- The following data is available:
- Unique visitors
- Visit duration
- Visits have bounced (left the website after one page)
- Actions (page, views, downloads, outlinks, and internal site searches)
- Max actions in one visit
- Pageviews
- Unique pageviews
- Unique keywords
- Downloads
- Unique downloads
- Outlinks
- Unique outlinks
- Each metric is paired with a mini trend line that shows how that metric has behaved over time.
- Become a Matomo expert: This card guides you on your journey to becoming a Matomo expert.
- Visitor Map: Displays the geographic locations of your website visitors, showing where your traffic comes from around the world.
- Channel Types: Shows how visitors reach your website by categorizing traffic sources such as direct visits, search engines, social networks, and campaigns.
- Matomo.org Blog: Provides the latest news, updates, and tips from the official Matomo team to help you make the most of your analytics.
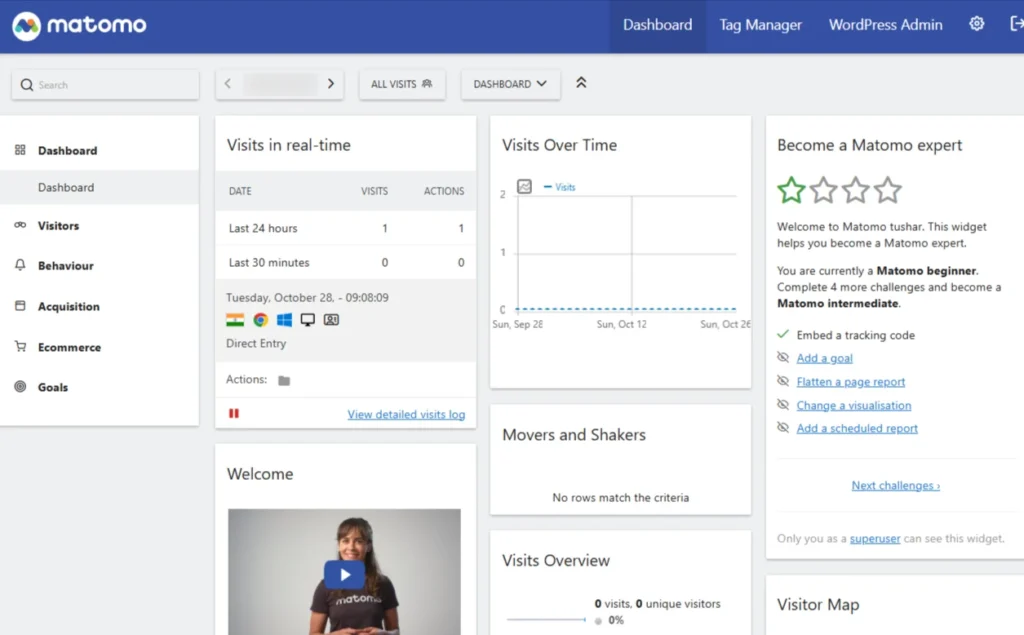
Screenshot 14: Reporting → Dashboard
Visitors
Shows who is visiting your site, their location, device, and behaviour, and how they interact during their visits.
Overview
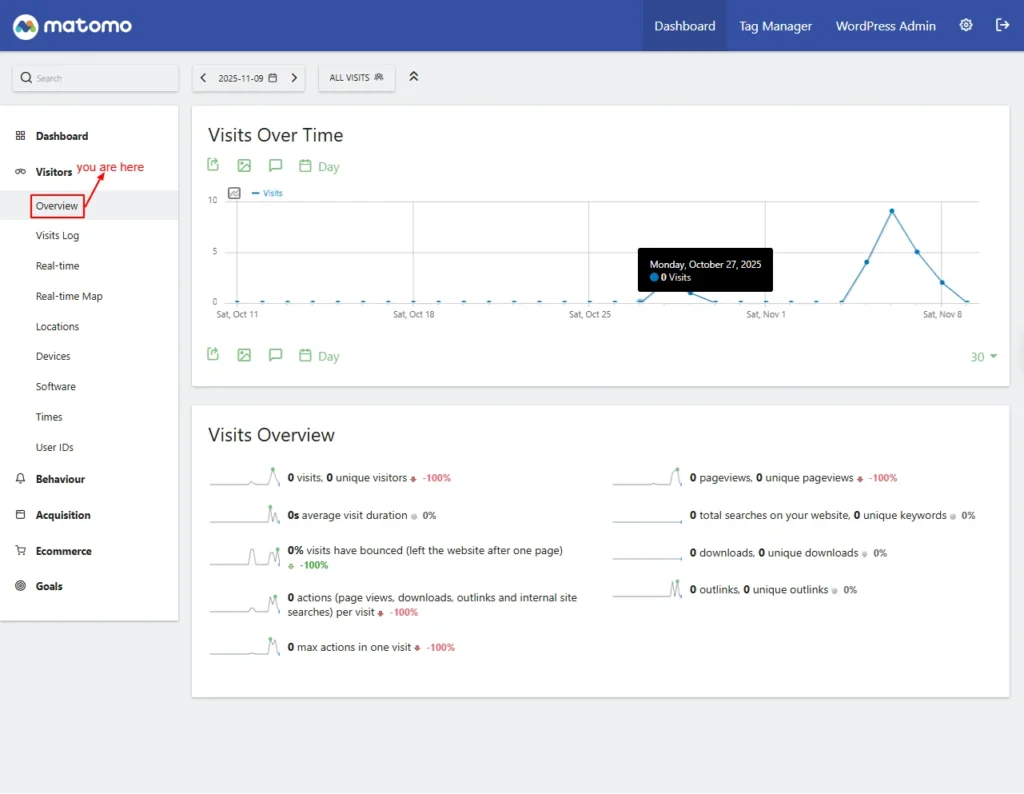
Screenshot 15: Visitors → Overview
Visits Over Time
This graph shows how many people visited your site within a selected date range.
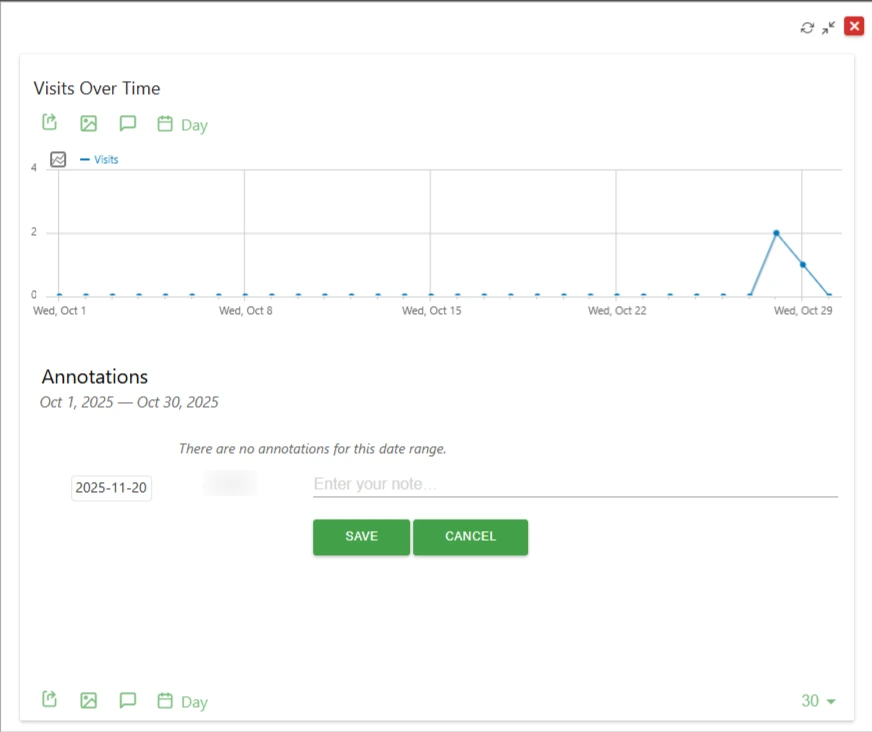
Screenshot 16: Annotations for date range
Visits Overview
This card gives a summary of key visitor statistics.
- Unique visitors, Number of total visits
- Average visit duration: Average time users stayed on your site.
- Bounce rate: Percentage of users who left after viewing only one page.
- Actions per visit: Average actions (pageviews, downloads, searches) per visit.
- Max actions in one visit: The highest number of actions taken by a single visitor.
- Pageviews, unique pageviews: Number of pages viewed and unique pages viewed.
- Total searches, unique keywords: Count of internal searches and distinct keywords used.
- Downloads, unique downloads: Number of file downloads and unique files downloaded.
- Outlinks, unique outlinks: Number of outbound link clicks and unique link destinations.
Visits Log
This screen shows a detailed list of each visitor’s activity.
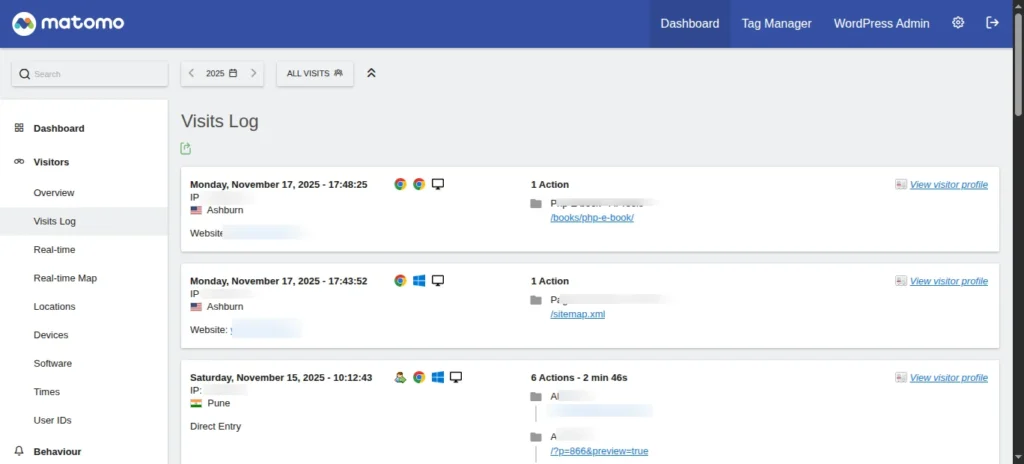
Screenshot 17: Visitors → Visit Logs
In the single row, it shows.
- Visit Time: Timestamp of when the visit occurred.
- IP: IP Address
- Location: Visitor’s country, region, or city.
- Referrer: Shows how the visitor arrived (search, social, direct, or link).
- Browser/OS/Device: Shows the browser and operating system used and device (desktop, tablet, mobile).
- Visitor Type (New/Returning): Indicates whether the visitor is first-time or returning.
- Actions Taken: Action with duration. Below is a list of all pages the visitor opened during the session.
- View Visitor Profile: This opens a new pop-up panel where the full activity history of a specific visitor is displayed.
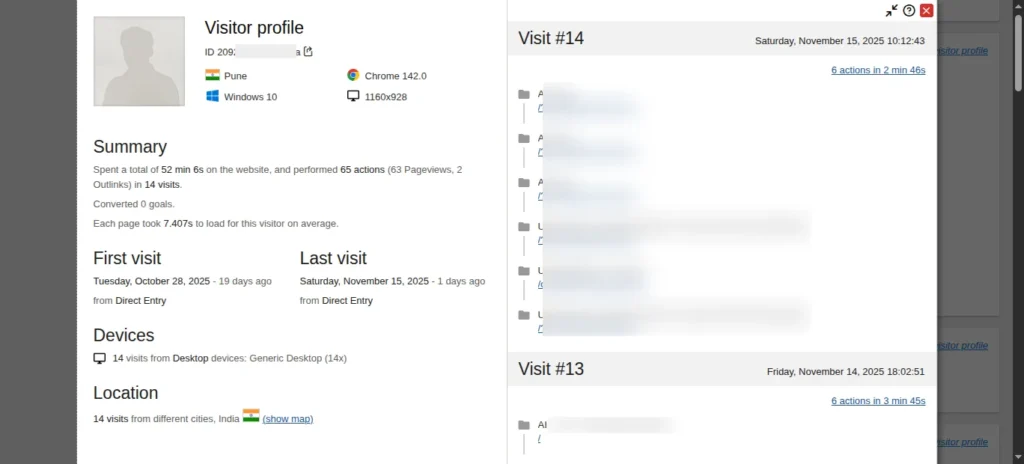
Screenshot 18: View Visitor profile
- Conversion Details: Displays goals or e-commerce conversions triggered.
- Custom Variables/Dimensions: Any additional custom data attached to the visit.
- Reload/Refresh: Updates the latest visits in real time.
- Segment/Filter: Allows filtering by visitor attributes or behaviour.
- Export/Download: Download raw visit data in different formats.
Real-time
This screen shows live visitor activity as it happens.

Screenshots 19: Visits in real time
The first two rows are
- Date
- Last 24 Hours: Live stats from the past 24 hours.
- Last 30 Minutes: Live stats from the past 30 minutes.
- Visits: Number of visitors within the selected time range.
- Actions: Total interactions (pageviews, clicks, downloads) in that period.
- The next row shows all the visits in real time.
- There is a button to start or pause visits in real time.
Real-time map
This screen shows live visitors on an interactive world map.
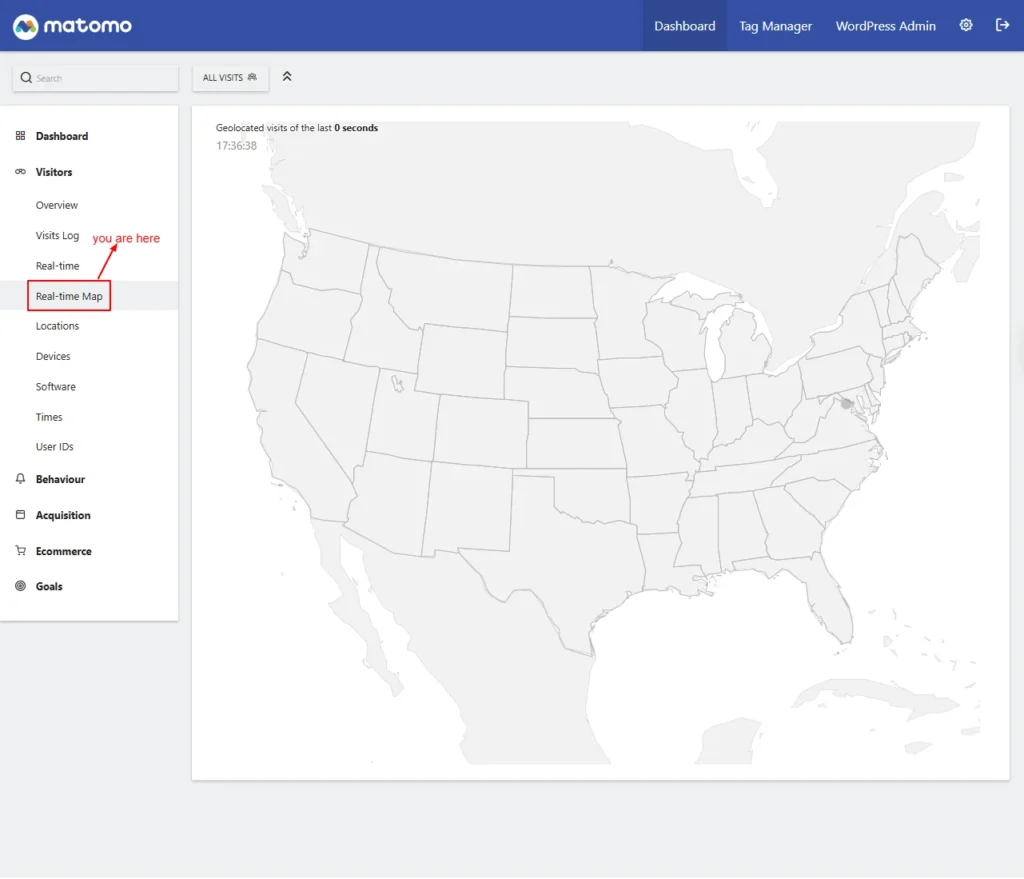
Screenshot 20: Visitors → Real Time Map
Locations
The Locations report shows where your visitors come from, displaying countries, regions, and cities to help you understand your audience’s geographic distribution.
- Visitor Map: This is the first card shown. It shows where visitors are located on a world map.
- Country: Lists visits by country.
- Continent: Group visits by continent.
- Region: Shows visits sorted by region/state.
- Distinct Countries: Number of unique countries visitors came from
- City: Shows visits grouped by city.
- Web-browser Language: Displays the language set in visitors’ browsers.
- Language Code (Related Report): Shows language codes used by visitors.
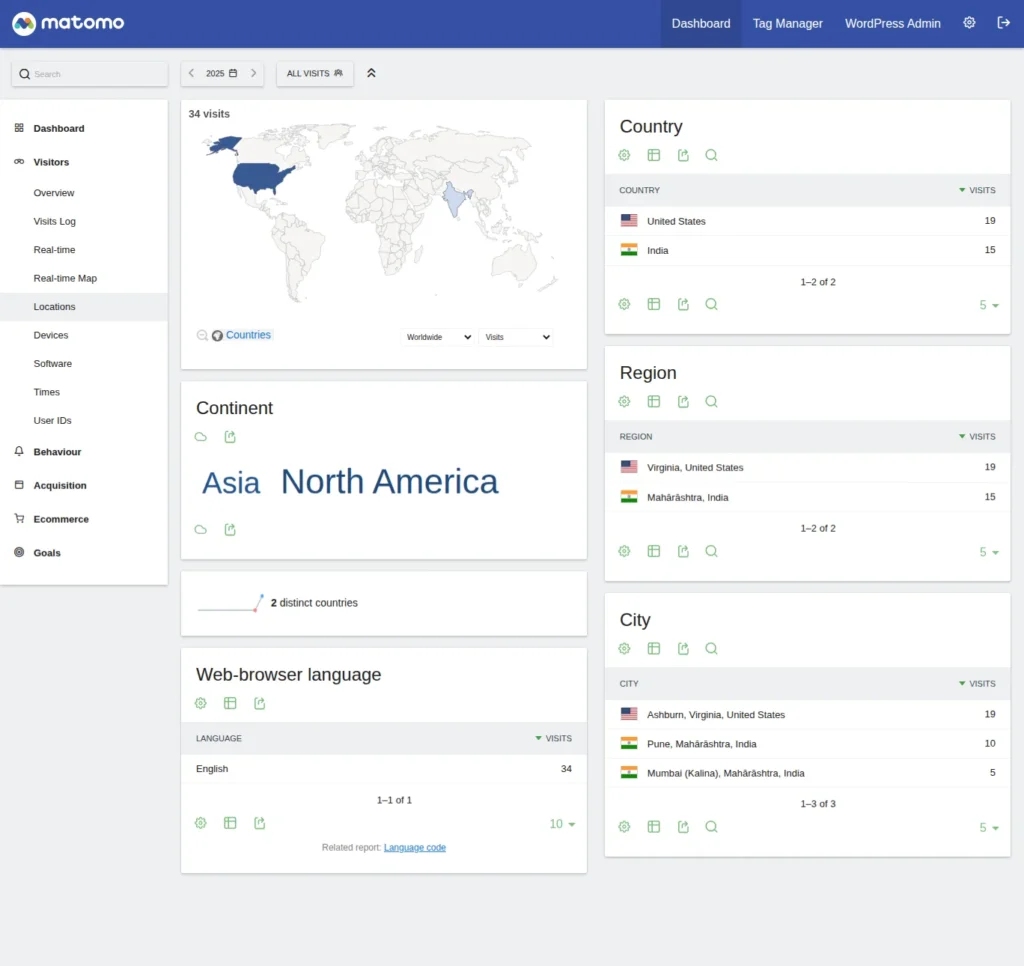
Screenshot 21: Visitors → Location
For all the cards, data can be displayed in the following formats:
- Displays a simple table
- Display a table with Visitor engagement metrics
- Display a table with Goals metrics
- Insights
- Vertical bar graph
- Pie chart
- Tag cloud
Devices
The Devices report shows the types of devices, operating systems, and screen resolutions your visitors use, helping you optimize your site for different user experiences.
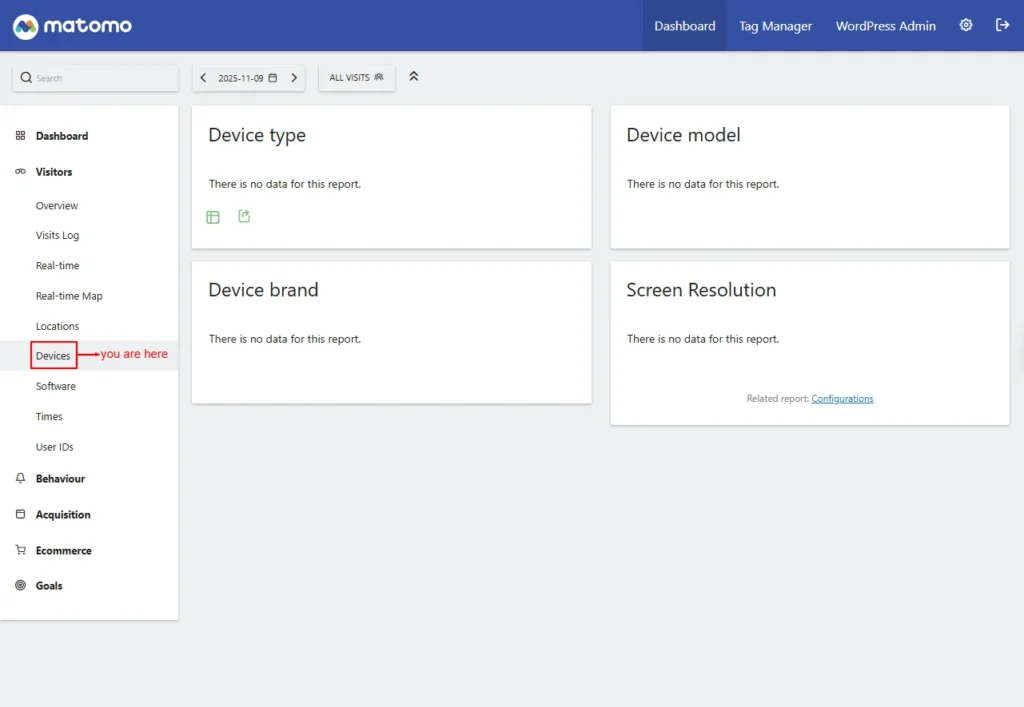
Screenshot 22: Visitor → Devices
Device Type: This shows the category of devices used
- Desktop
- Camera
- Car browser
- Console
- Feature phone
- Peripheral
- Phablet
- Portable media player
- Smart display
- Smartphone
- Smart speaker
- Tablet
- Tv
- Wearable
- Device Model: Shows the exact model of the visitor’s device.
- Device Brand: Displays the manufacturer of visitor devices.
- Screen Resolution: Lists screen sizes used by visitors.
For every card, there is an option to display the total row, change the visualization, export the dataset in other formats, and search.
Software
The Software report displays the browsers, browser versions, and operating systems your visitors use, helping you understand their technical environment.
- Operating System Versions: Shows the specific OS versions used by visitors.
- Operating System Families (Related report): Groups visitors by OS family (Windows, macOS, Linux, etc.).
- Browsers: Shows which web browsers visitors used.
- Browser Version (Related Report): Lists versions of each browser.
- Configurations: Lists detailed browser + OS + device combinations.
- Screen Resolution (Related Report): Shows visitors’ screen sizes.
- Browser Plugins: Displays browser plugins detected for visitors. (Note: Not tracked for IE < 11; only for modern browsers.
- Browser Engines: Shows which rendering engines (e.g., Blink, WebKit, Gecko) were used.
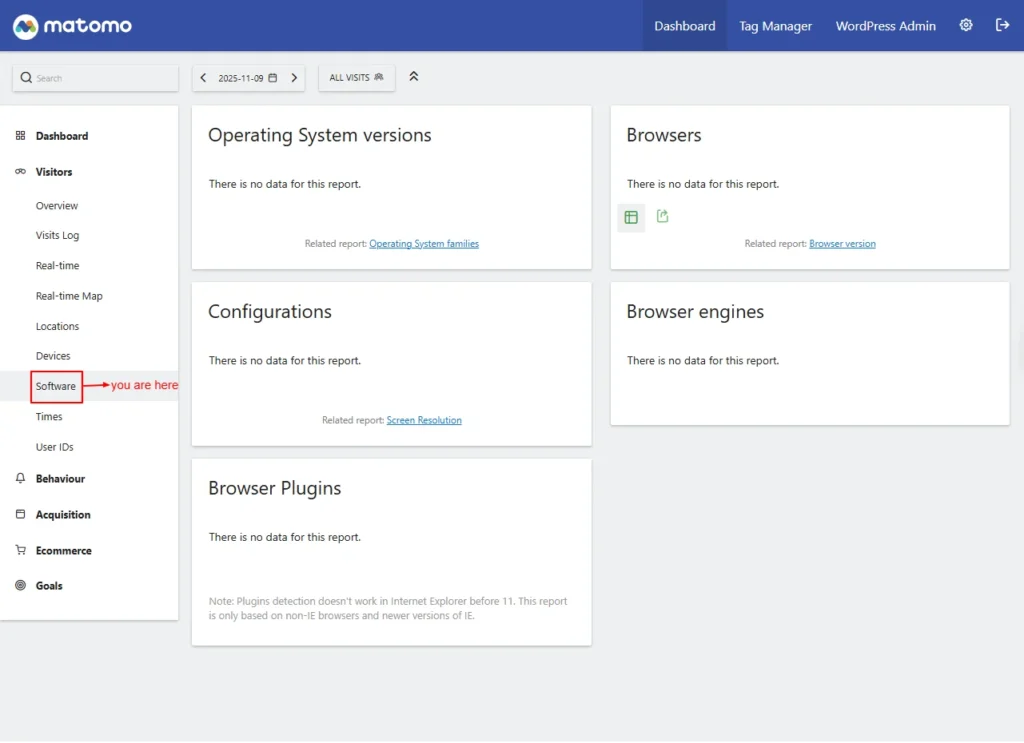
Screenshot 23: Visitors → Software
Times
The Times report shows when visitors access your site, highlighting peak hours and daily activity patterns to help you understand user behaviour over time.
The first graph shows the local time in each visitor’s own time zone when they accessed your site. The second graph shows the corresponding times based on your site’s time zone.
- Visits per Local Time: Shows visits based on each visitor’s local time.
- Visits by Day of the Week (Related Report): Displays how traffic varies across weekdays.
- Visits per Hour in the Site’s Timezone: Shows visit distribution by hour using your site’s timezone.
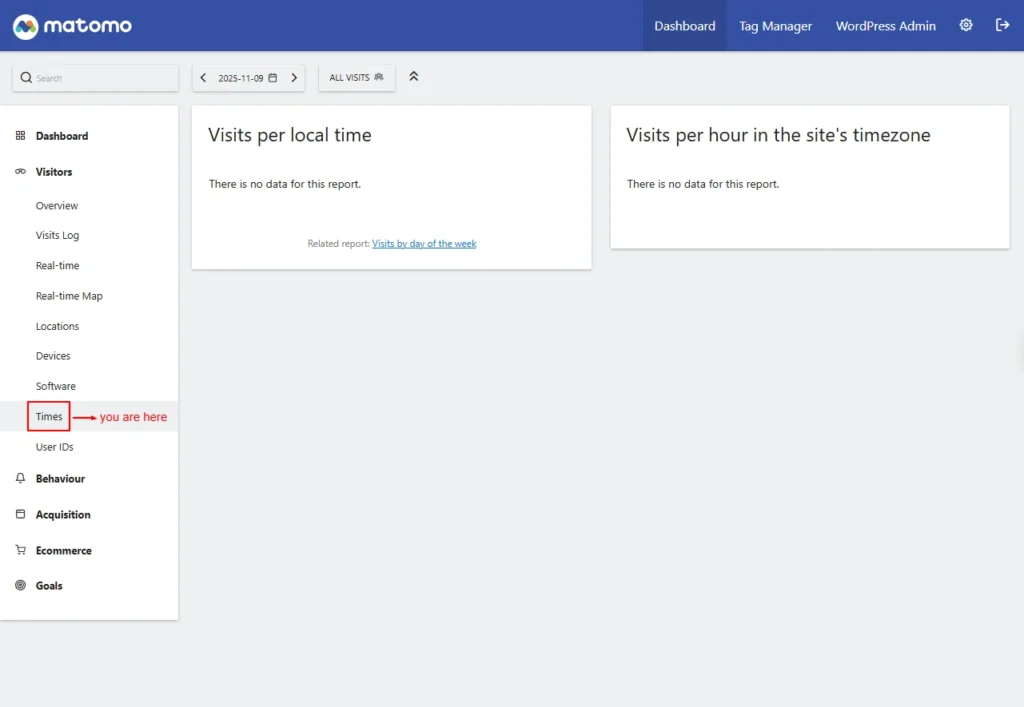
Screenshot 24: Visitors → Times
User IDs
The User IDs report tracks activity from logged-in or identified users, allowing you to view individual user journeys and behavior across your site.
This screen lists visits grouped by assigned user identifiers (such as a username or email).
Note: If no data is displayed, a User Guide Link is shown, which provides instructions for enabling and generating User ID data. This is discussed in the next section of the Settings menu.
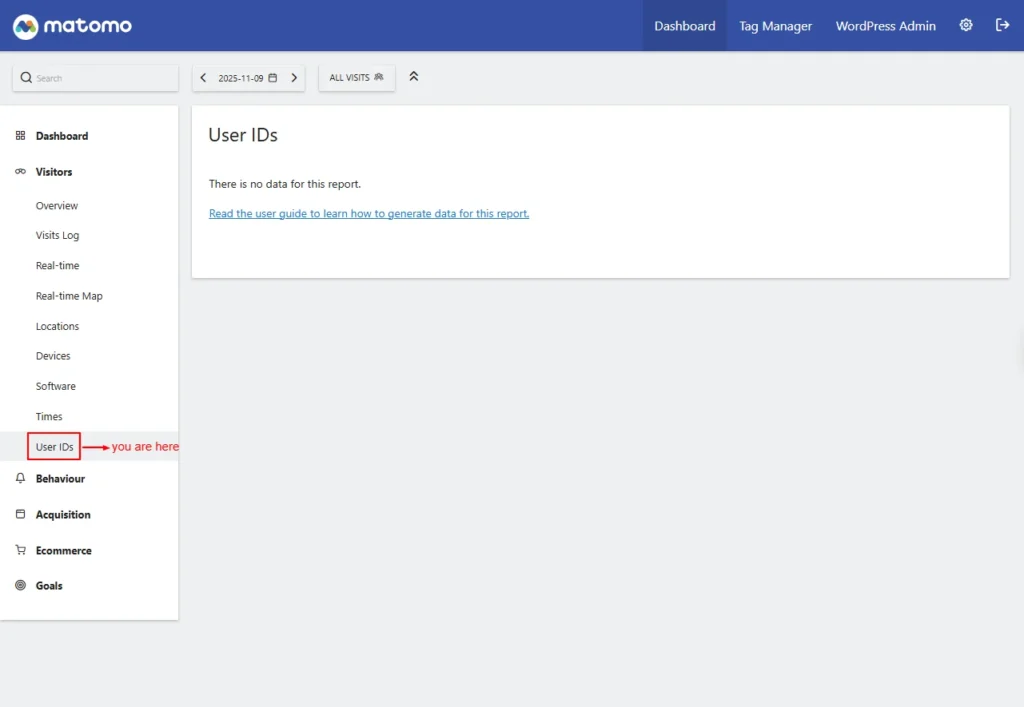
Screenshot 25: Visitors → User IDs
Conclusion
Setting up your WordPress site with Matomo isn’t just about installing another analytics plugin; it’s about building a strong, privacy-friendly, fully owned data foundation.
In this first part, we covered how to install the Matomo plugin, update your privacy page, enable tracking, and understand the core reporting areas that will guide your decision-making.
With your analytics framework in place, you now have the clarity, accuracy, and control needed to understand how users interact with your website. This foundation ensures your tracking is compliant, your insights are reliable, and your decisions are based on real behavior, not guesswork.
Next up in Part 2, we’ll dive deeper into Matomo’s advanced reporting features. You’ll learn how to interpret user behavior, track performance across channels, measure conversions, and unlock powerful insights across:
- Behaviour Reports
- Acquisition Reports
- E-commerce Reports (if enabled)
- Goals
- Tag Manager
- Settings
Published on Dec 2, 2025 | Updated on Dec 26, 2025